
For good or ill, the stock market is obsessed with what the Federal Reserve does with short-term interest rates.
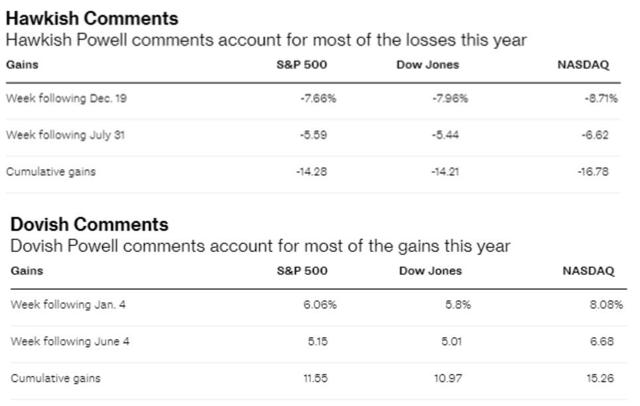
Much of this year's 22% total return on the S&P 500 has come as a result of the Fed turning more dovish, including cutting the Fed Funds rate twice this year.
Jerome Powell at the conference call said that the Fed remains confident in the overall state of the economy but is open to possibly cutting more, purely for insurance against a recession. A recession that the bond market, via the 10y-3m yield curve, is now estimating is 38% likely to happen within a year.
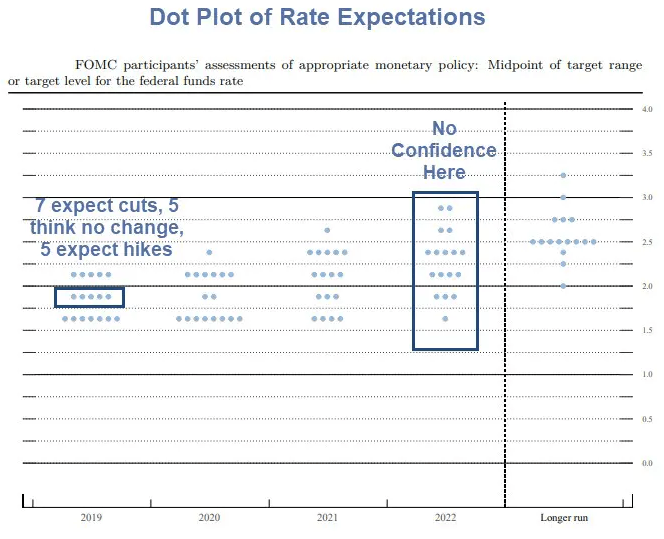
You can see that both in the Fed's latest dot plot, as well as the FOMC's economic expectations table. The dot plot shows a slight plurality of members expecting one more hike this year, and then no changes to interest rates next year. By 2021, the Fed thinks it will be safe to raise raises at last once and two times over the long term (2023 and beyond).
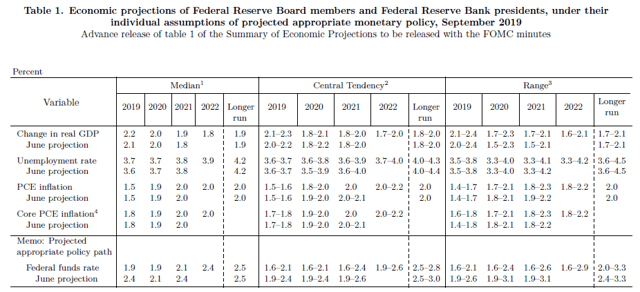
There is a lot of uncertainty in these rate estimates, even among the Fed members. That's because the median consensus for this year and next is 2.2% and 2% GDP growth, respectively, basically what we've had over the past decade.
But note that the range of growth estimates for next year is from 1.7% to 2.3%, up slightly from June when some bearish Fed members expected just 1.5% growth in 2020.
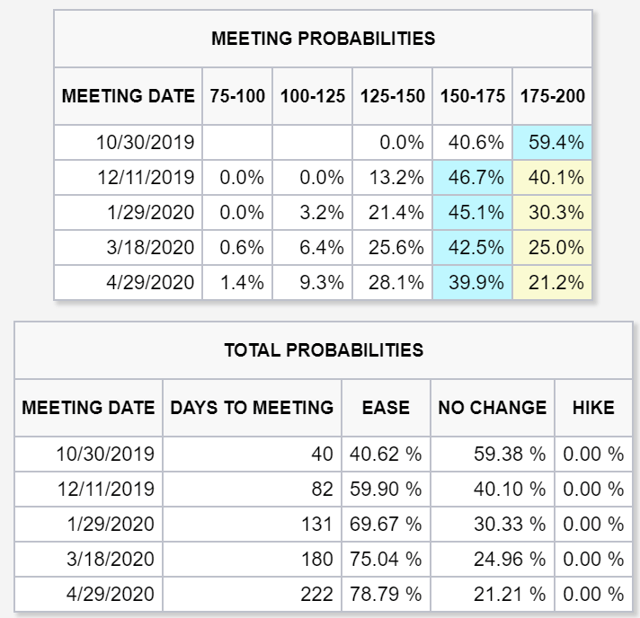
The bond market now expects a 60% probability of at least one more cut by December, and then about a 40% probability of one more (total of four) by April 2020.
The rate obsessed stock market generally follows the bond futures estimates, meaning that current broader market multiples may be expecting more rate cuts than the Fed is actually saying it's willing to deliver. But let's say that the Fed does decide to give the bond, stock, and President Trump what they want, and take a hatchet to short-term rates.
That's not necessarily good news for your portfolio in the short term.
...That Isn't Necessarily A Great Thing For Stocks
I actually admire Jerome Powell and the FOMC for their dedication to data-driven policy. I am confident that the FOMC is truly apolitical and attempting to look at the aggregate data and then make prudent and reasonable decisions that are most likely to deliver full employment and stable prices (its dual mandate from Congress).
If the Fed cuts more than once more, it means bad news for the economy, and thus for corporate profits and stock prices.
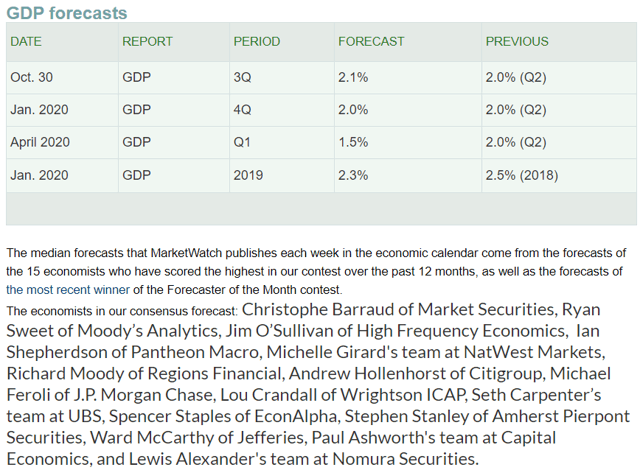
Since last quarter, the median consensus of the 15 most accurate economists/analysts tracked by MarketWatch, has deteriorated, with Q1 2020's growth expected to be just 1.5%. That's considered "stall speed" meaning if growth falls that low a vicious cycle of business and consumer pessimism could push us into a recession.
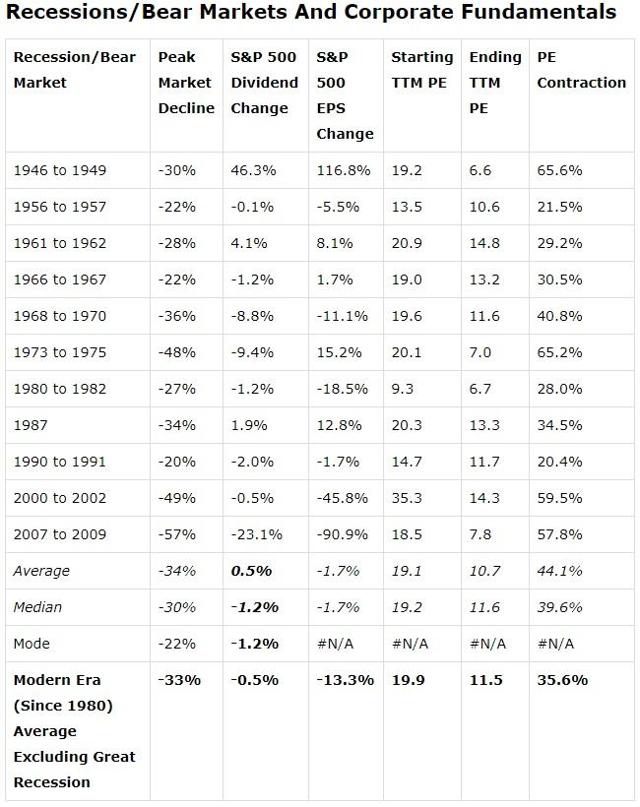
Since 1945, we've never had a recession without stocks falling into a bear market, created by a combination of declining earnings and significant multiple contraction (dividends hardly get cut at all, however).
Think of it like this, if short-term interest rates (or even interest rates in general) were all that mattered to stock prices, then the S&P 500 would do best during recessions when interest rates fall to their lowest levels.
The simplistic idea that "low rates are good for stocks" fails to account for the famous economic concept of "all else being equal". If the Fed cut rates to zero today, then given our still solid economic fundamentals stocks would indeed likely go up a lot.
But the Fed won't cut rates more than once unless recession risk is likely above 50%. No matter how cheap borrowing becomes, debt is still a liability (a claim on a company's or person's future cash flow and assets). It must be paid back over time. A company who is worried about negative sales and earnings growth won't borrow to invest in expansion. Nor will consumers (who drive about 70% of GDP growth with their spending) ramp up spending if they fear job losses.
The good news is the current economy remains sound, with little near-term recession risk. That's not just based on the Fed's expectations table or the median economist consensus, but an objective reading of 19 leading indicators, which collectively predicted the last four recessions.
The mean of coordinates or MoC is the single best representation of the US economy, overall, factoring in all economic reports.
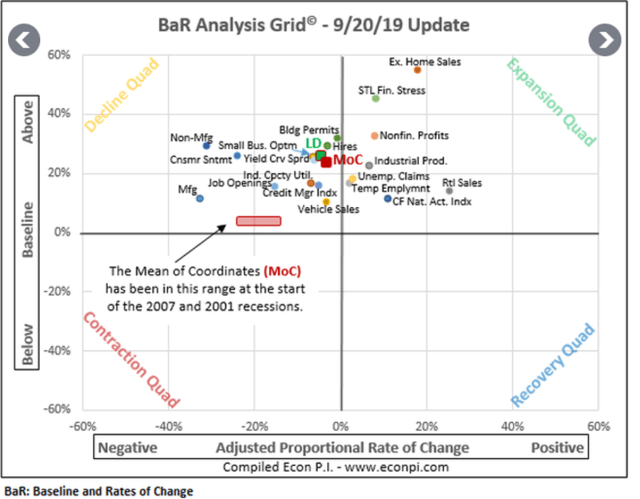
Back in October 2018, the peak of this economic cycle, the average of all indicators was 35% above their historical baselines and expanding about 10% month over month. Today, we're about 24% above baseline and contracting about 5% month over month.
The green "LD" dot is the eight most sensitive indicators (yield curve is one) and indicates where the red MoC dot is likely to go if conditions persist. The good news is that LD is above MoC, the bad news it's showing slightly faster monthly contraction.
Basically, this means that US growth is slowing and now likely to be about 1.5% to 2% next year.
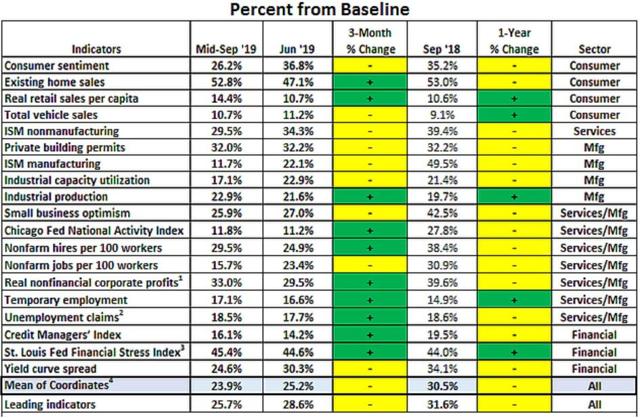
However, even that level of growth is still ok, because unless the MoC falls below 20% above baseline a recession is very unlikely within a year. 23.9% above baseline indicators a third rate cut is reasonable and prudent, and then no more unless fundamentals deteriorate further.
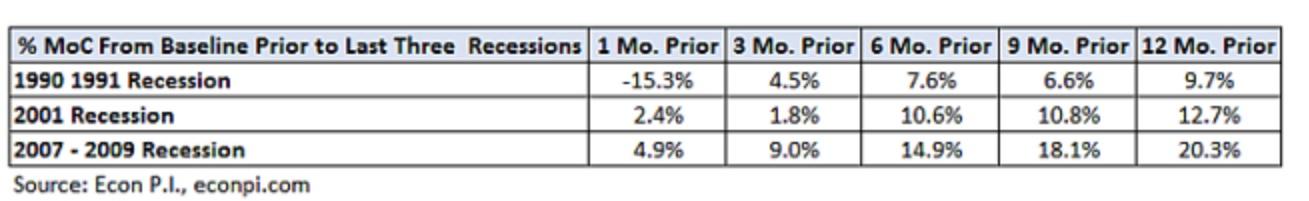
23.9% is where we sit now, with the eight most sensitive indicators at 25.7%. Note that prior to the mild recessions of 1990 and 2001, even a reading of 12.7% above baseline still meant a recession was at least a year away.
David Rice, who built this economic tracking tool (which I use to determine how much of my monthly savings to invest in stocks), confirms that 20% is the danger zone for a possible recession. We're now likely at least 14 months away from recession based on the most recent trends in economic data. But that's assuming we get a recession at all.
The trade war, and the uncertainty it's caused consumers and businesses, is the primary reason a recession will occur in 2020 or 2021 if it does. An end to that trade war (it's very unlikely to last forever) would prevent a recession, as could more rate cuts, though there is only so much pushing on a string the Fed can do. Moody's estimates that the Fed cutting to zero would boost US GDP growth by about 1% within 12 months.
So, basically, this means there is a 62% probability of no recession over the next year, and the economic data supports the Fed's assertion that no downturn is likely coming soon. Which means, that, in the words of legendary investor Joel Greenblatt, it's still a good time to "buy above-average quality companies at below-average prices".
The Dividend Kings' Approach To Valuing And Recommending Stocks
In summary, here is what our valuation model is built on:
- 5-year average yield
- 13-year median yield
- 25-year average yield
- 10-year average P/E ratio
- 10-year average P/Owner Earnings (Buffett's version of FCF)
- 10-year average price/operating cash flow (FFO for REITs)
- 10-year average price/free cash flow
- 10-year average price/EBITDA
- 10-year average price/EBIT
- 10-year average Enterprise Value/EBITDA (factors in debt)
These metrics represent pretty much every company fundamental on which intrinsic value is based. Not every company can be usefully analyzed by each one (for example, EPS is meaningless for REITs, MLPs, yieldCos, and most LPs). But the idea is that each industry appropriate metric will give you an objective idea of what people have been willing to pay for a company.
I line up the expected and realistic growth rates of companies with time horizons of similar growth, thus minimizing the risk of "this time being different" and overestimating the intrinsic value of a company.
I maintain 9 total valuation lists, covering:
- 47 level 11/11 quality Super SWANs (the best dividend stocks in America, who collectively have tripled the market's annual returns over the past 25 years)
- All the Dividend Kings
- All the Dividend Aristocrats
- All safe (level 8+ quality) midstream MLPs and c-Corps
- All DK model portfolio holdings
- Our Top Weekly Buy List
- Our Master Valuation/Total Return Potential List (182 companies and counting)
It's from these lists that I present six potentially excellent long-term dividend growth opportunities you can safely buy in today's frothy and uncertain market.
6 Great Dividend King High-Yield Recommendations For A Frothy Market
For volatility-intolerant investors who are still worried about a recession, here are three excellent defensive buys right now.
Altria is the highest yielding and most undervalued dividend king, courtesy of a perfect storm of merger uncertainty, and recent scary headlines about vaping.
The reason this is my highest conviction buy for conservative income investors who don't mind owning tobacco companies can be summarized with one chart.
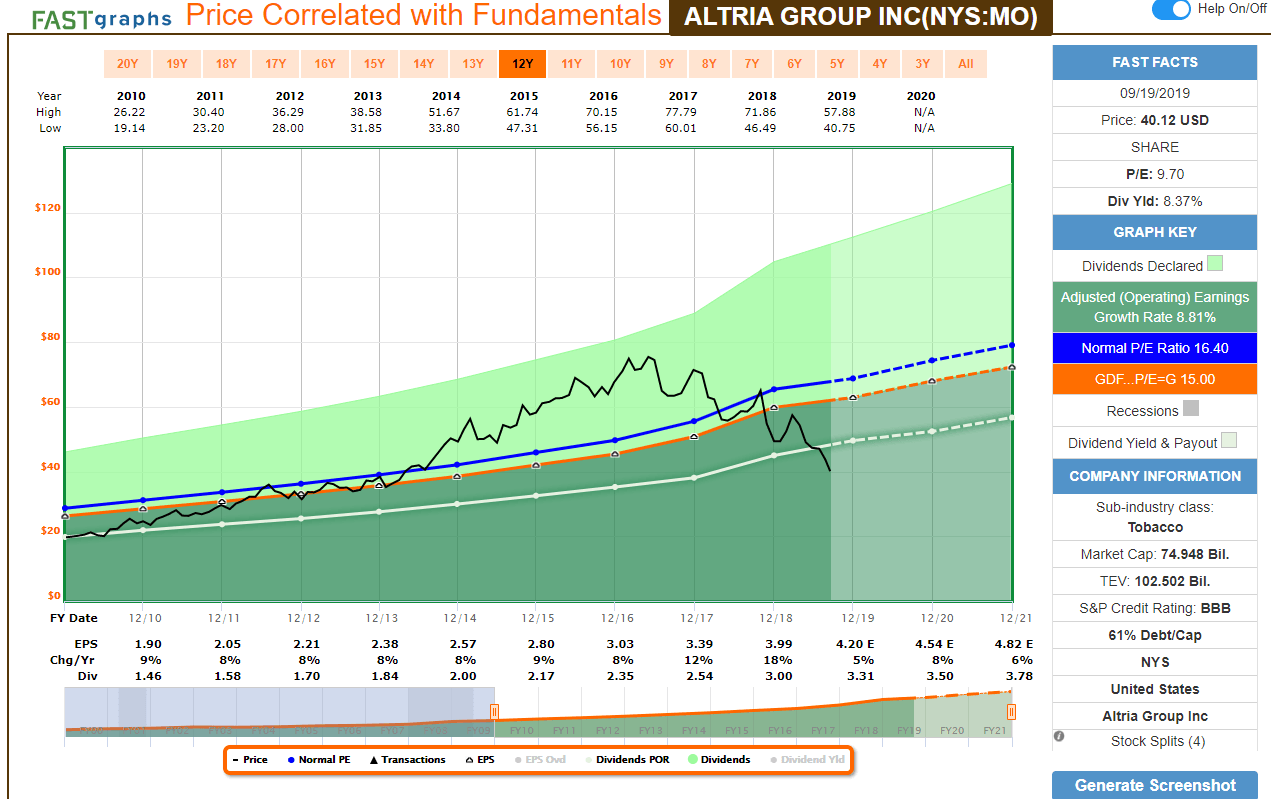
The blue line is operating earnings (payout ratio policy is 80% of adjusted EPS), and the white line is dividends. Altria has only delivered negative EPS growth in one year since 2000 (a 2% decline in 2003).
Despite over 50 years of steadily falling smoking rates and cigarette volumes, this defensive dividend king has delivered on the only thing that matters, growth in EPS, FCF/share and dividends.
I'm not the only analyst who has confidence that Altria will deliver on its long-term 7% to 9% EPS growth guidance. Recently, Bank of America analysts Lisa Lewandowski and Christopher Carey called Altria a "buy" noting,
Tobacco has a long history of being resilient and adaptable. We still see MO as best positioned to adapt to US industry challenges and await further comments from MO/PM mgmt about a possible merger."
This week, I'm doing another deep dive on the possible Altria/Philip Morris merger, specifically walking readers through the three possible outcomes for each company.
- no merger
- PM buying MO for no premium (effective dividend cut)
- PM buying MO in an all-stock deal at 0.718 to 0.8 PM/MO shares (the most likely outcome)
No matter what happens with the merger (I estimate 75% probability of a merger occurring), my thesis on Altria is based on a safe 8.4% yielding dividend that grows steadily over time. As I'll explain in that article, the recent vaping hysteria is not actually a significant threat to MO's fundamentals, just its short-term share price.
At 4% to 9% growth over time, and a return to a 15 to 16.4 PE (Chuck Carnevale/Ben Graham's 15 PE rule of thumb, and its 10-year historical average), ultra-high-yield Altria is likely capable of 17% to 26% CAGR total returns over the next five years.
Which is why I've been buying with both hands, purchasing over 550 shares in recent weeks, at steadily lower prices. Mind you, as Bank of America points out, barring a merger announcement Altria may continue to languish or fall even further. A potential JUUL writedown could send shares plunging, so size your position appropriately for your risk tolerance, and also leave room to add more if it were to decrease to even more absurdly undervalued levels.
My personal risk limit is 12% on Altria, but only if it falls even lower and most people should stick with 5% to 10% position sizes on blue chips.
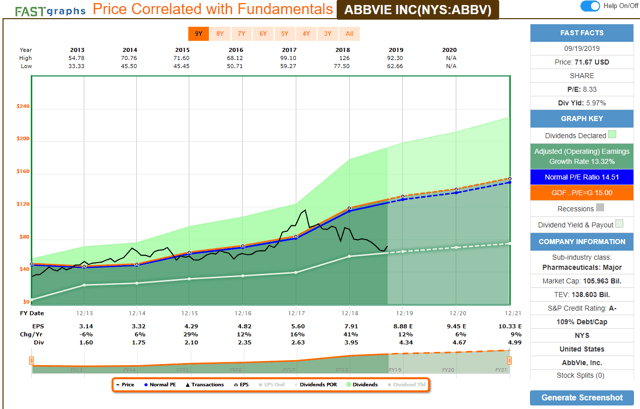
Dividend aristocrat AbbVie is up 8% over the past month, but still incredibly undervalued, as you can see. Like Altria, the market is obsessing over risks, and ignoring the objective reality that the excellent management team is delivering on its long-term plan to deal with those risks and drive long-term industry-leading earnings, cash flow, and dividend growth.
At the recent Morgan Stanley Global Healthcare Conference, CEO Rick Gonzalez told analysts that its new blockbusters, Skyrizi and Rinvoq, are making good progress on steadily gaining more indication approvals. Their rollout on initial ones is proceeding well, making the company "absolutely comfortable" with its $10+ billion combined sales forecast in 2025.
Analyst estimates tend to be much lower for combined sales of Skyrizi and Rinvoq, but the consensus is for AbbVie to continue growing at industry leading rates, even with Humira biosimilars now available in the EU, more coming globally, and finally, nine rival drugs launching in the US in 2023.
Factoring in management's 10%-20% EPS boost guidance from the $63 billion Allergan (AGN) merger closing in early 2020, here is how fast AbbVie's earnings and cash flow are likely to grow, per current analyst consensus.
- 2019: 12% (management's guidance, raised twice this year)
- 2020: 16% to 19% (factoring in 10% immediate EPS boost plus 1% to 3% synergies)
- 2021: 9% to 12% (consensus growth + 1% to 3% synergies, 10% EPS boost from synergies spread out over three years)
- 2022: 10% to 13% (consensus growth + 0% to 3% synergies, which may or may not be fully realized)
- 5-Year CAGR EPS growth (factoring in 2023's Humira biosimilars): 6% - ignores AGN acquisition
I personally use a 5% to 10% long-term growth rate on AbbVie, which I consider a reasonable estimate, given management's massive drug pipeline following the AGN deal (the second-best in the industry per EvaluatePharma).
- 5% long-term growth and 12 PE (vs 14.5 historical and 15.0 being "reasonable" according to Chuck Carnevale and Ben Graham) = 15% CAGR total return potential
- 10% long-term growth and 14.5 historical PE = 26% CAGR total return potential
Even using more conservative growth estimates than analysts, and assuming a permanently undervalued PE, AbbVie should be capable of at least doubling your investment over the next five years. At the high end of my realistic return potential, AbbVie could deliver 225% total returns, more than tripling your money.
TELUS is my favorite telecom company and a holding in two Dividend King's portfolios ($1 Million Retirement and High-Yield Blue Chip). Why do I like TELUS so much? Like all telecom blue chips, it's recession-resistant, wide moat (Canada has just three big telecoms) and a good source of generous, safe and rising income in all economic conditions.
But unlike AT&T (T) and Verizon (VZ) which offer generous safe yields growing at an inflation-adjusting 2% per year, TELUS is a relative growth rockstar.
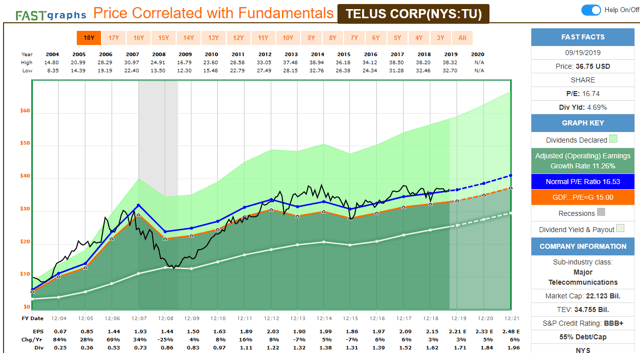
Over the past 15 years, TU has grown EPS 11.3% CAGR and dividend by 14% CAGR. Analysts expect it to deliver 8% CAGR growth over the next five years, which I consider reasonable, given its strong 5G related growth plans.
Applying its 16 historical PE (over the past decade) to the realistic growth potential of 4% to 9%, I estimate total return potentials of:
- 4% growth rate = 7% CAGR total returns
- 9% growth = 13% CAGR total returns
If analysts are right about 8% growth over time, then TU should easily deliver double-digit returns, about double what many asset managers expect from the market over the next five years. TELUS isn't a deep value investment, just a quality defensive high-yield choice, trading at a reasonable price.
For volatility-tolerant investors who are looking to buy quality economically sensitive (cyclical) companies that stand to profit the most if we avoid recession, here are three excellent companies to consider:
FedEx is the latest new company in Dividend King's Deep Value portfolio. We bought it opportunistically after a guidance cut for 2019 and 2020 caused it to plunge 13%. Yes, FedEx is struggling with the trade war and no longer servicing Amazon (AMZN), which was just 2% of revenue. But management is still confident enough in the business, that, despite a 20% expected EPS decline next year, it's still investing $5.9 billion into a massive growth initiative.
By the way, even factoring in a 21% expected EPS decline next year, the consensus on FDX's long-term growth is 13% (9% to 14% is a realistic range based on historical growth and fundamentals).
- 2021 analyst expected EPS growth 13%
- 2022 expected growth: 16%
- 2023 expected growth: 19%
During periods of similar growth rates, FedEx averages a 17 PE, the market's objective assessment of what it's worth, given similar fundamentals and long-term growth potential.
Today, FDX trades at a PE of 10.5, and while the market is obsessing over a scary EPS drop in 2020, here's what Dividend Kings is focused on instead.
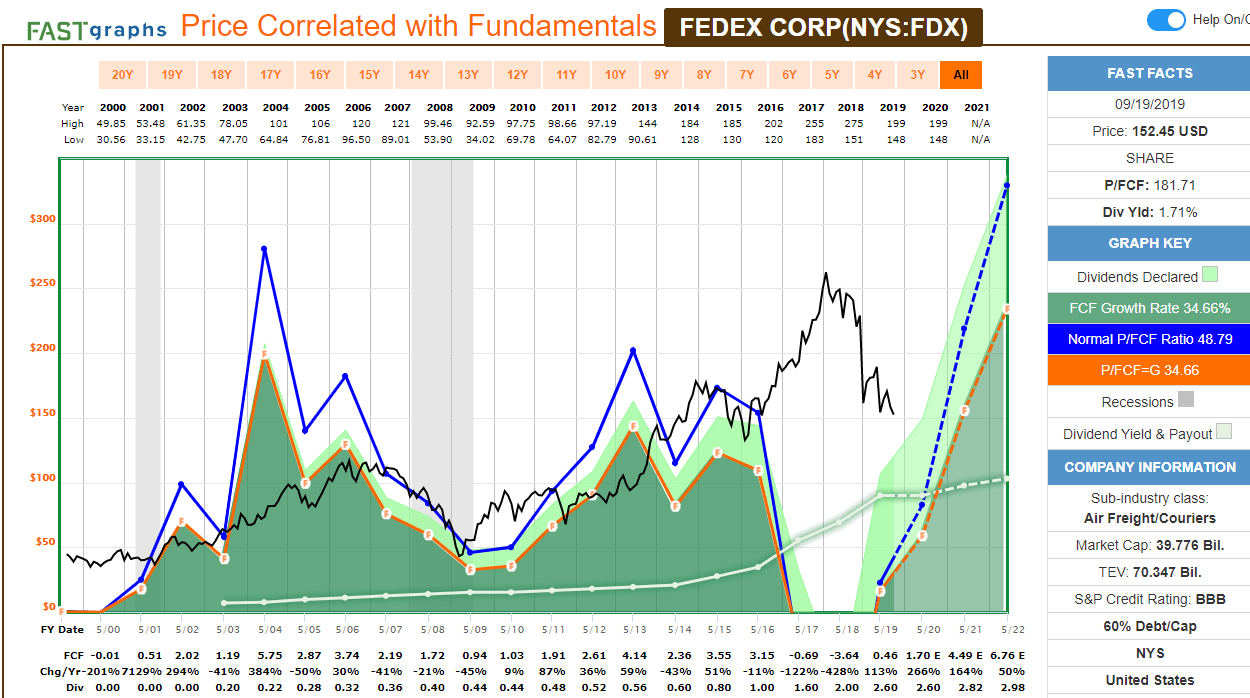
FDX's free cash flow has always been volatile, due to the economically sensitive and capital intensive business model. That hasn't stopped it from delivering 17 years of consecutive years of double-digit dividend growth.
Now, it's true that the unprecedented scale of the growth spending is expected to cause a dividend freeze in 2020 (management may choose to preserve the streak with a token hike). But what matters to long-term income growth investors is the free cash flow boom that's likely to result as long as the trade war doesn't last forever (a fair assumption).
By 2022, analysts expect a nearly 15 fold increase in FCF/share compared to 2019, which would be 63% above the previous record set in 2013. FedEx's sound investment-grade balance sheet should allow for above-average payout safety, even if it loses its dividend challenger status.
But FedEx has never been a high-yield stock and owning it is about strong growth and excellent long-term returns.
- 9% growth and a 15 PE (vs 17 historical average) = 19% CAGR total return potential
- 14% growth and 17 historical PE = 28% CAGR total return potential
Our Deep Value portfolio seeks above-average quality companies with 15+% long-term return potential. FedEx fits that bill very nicely, especially given its potential to deliver 20+% returns, which would more than triple our money.
Energy Transfer is the second most undervalued stock on the Dividend Kings' 186 company master watchlist.
That's courtesy of a five-year midstream bear market that has reached the point of absurdity (private equity is snapping up midstream assets hand over fist due to the best valuations in 15 years).
Midstream Bear Market Drags On...And On...And On
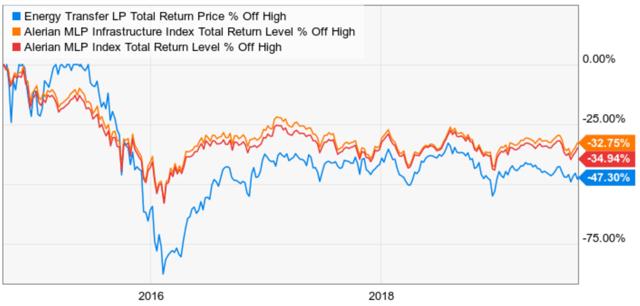
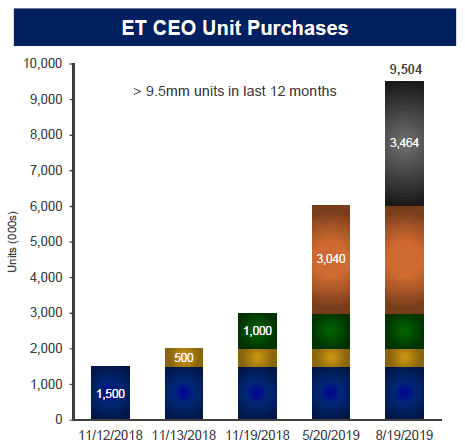
Energy Transfer's own CEO and founder Kelcy Warren has bought nearly 10 million units over the past year (he, directly and indirectly, owns 31% of it paying him over $250 million per year in tax-deferred income).
I just confirmed that what management said about the $5 billion SemGroup acquisition is true, specifically that
- the deal is mildly accretive to DCF/unit (what funds the 9% yield)
- credit neutral (no significant changes in debt/EBITDA or interest coverage)
- a sound strategic move that boosts ET's future growth prospects via 63% immediate increase in oil export capacity
The thesis behind Energy Transfer is simple. You're getting paid 9% per year, in tax-deferred income, which by itself is likely to not just potentially fund a prosperous retirement but beat the market over the next five to years.
The 1.8 distribution coverage ratio (guidance for 2019, but 2.03 in the first half of the year) means that self-funding Energy Transfer's payout is highly secure. It better be, given that Kelcy Warren's salary is $1 and he gets all his income from these distributions.
Leverage is on track to hit management's target of 4.0 to 4.5 next year, (4.3 now) which likely means buybacks and modest distribution growth starting in 2020.
Energy Transfer expects to invest about $3.5 billion per year in growth projects overtime to support America's energy boom (about $1 trillion in new midstream infrastructure needed by 2050).
- 1% long-term cash flow growth (lowest consensus growth rate of next three years): 19% CAGR 5-year total return potential
- 11.2% growth (five-year analyst consensus): 33% CAGR total return potential
Analysts expect cash flow (EBITDA) to grow double-digits over the next five years, though growth in any given year may be lumpy due to the timing of project completions.
But even with very modest cash flow growth, ET, trading at 3 times EBITDA and 8.5 EV/EBITDA is so undervalued that multiple expansion is likely to deliver truly astounding returns.
All while you collect a safe 9% yield, backed up by long-term fixed-rate contracts with minimum volume commitments (which represent 87% of ET's cash flow).
Broadcom is my favorite tech recommendation right now. I just increased my retirement portfolio position 60%, and it's a holding in three Dividend Kings' model portfolios. Why? Because CEO Hock Tan is the Jeff Bezos/Warren Buffett/Brookfield Asset Management of his industry.
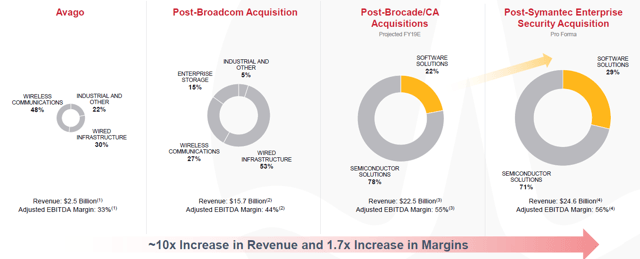
No one does highly accretive M&A better than Tan, who has grown turned Broadcom into one of the most profitable companies on earth (40% FCF margin). Over 30% of cash flow will be coming from monthly recurring enterprise software revenue-creating the most stable cash flow in the industry.
Yes, Broadcom's $10.8 billion Symantec enterprise acquisition will mean a lot of debt (4.3 leverage). But management is guiding for $9 billion in FCF this year (up 10%), and analysts expect a 15% boost to FCF/share next year. Broadcom plans to pay 50% of free cash flow as dividends (a safe level for the industry) and use the rest to repay debt, and allow it to eventually make more super-profitable acquisitions in the future (likely more software).
While debt-funded M&A is very hard to pull off well, Hock Tan has my confidence, enough for me to use a policy of "always buy AVGO if it's undervalued and crashes 5+% in a day".
Management guidance is for long-term double-digit growth. 10% to 15% is realistic (12.1% is analyst consensus), and here are the 3.7% yielding tech blue chip's long-term return potentials
- 10% long-term growth and historical 13.8 PE = 13% CAGR total returns
- 15% growth and 15 Chuck Carnevale "reasonable" PE = 20% CAGR total returns (triple your money in 5 years) - more stable cash flow supports a modest expansion in multiples
If you're looking for a great fast-growing, high-yield tech stock to buy today, that might soar on news of a trade deal, or simply no recession occurring next year, then Broadcom is a reasonable and prudent choice. Just size your position size appropriately for your risk tolerance and to leave room for buying more during the stocks many, many short-term freakouts.
What if none of these companies, all representing above-average quality income growers trading at reasonable to great values, fits your personal needs?
That's where the rest of this article comes in. Let's walk through how to screen a quality watchlist for valuation, to help you make consistently sound decisions with your savings.
Morningstar Is A Good (But Not Perfect) Place To Start Looking For Good Ideas
Morningstar is typically (though not always) a good starting location for blue-chip income investing ideas. That's because they are 100% focused on long-term fundamentals, rather than 12-month price targets like most sell-side analysts (the ones that issue "Buy, Sell, Hold" recommendations). Most of their fair value estimates are reasonable (though not always - more on this in a moment). So, here are all my blue-chip watch list stocks that Morningstar estimates are at least 20% undervalued.
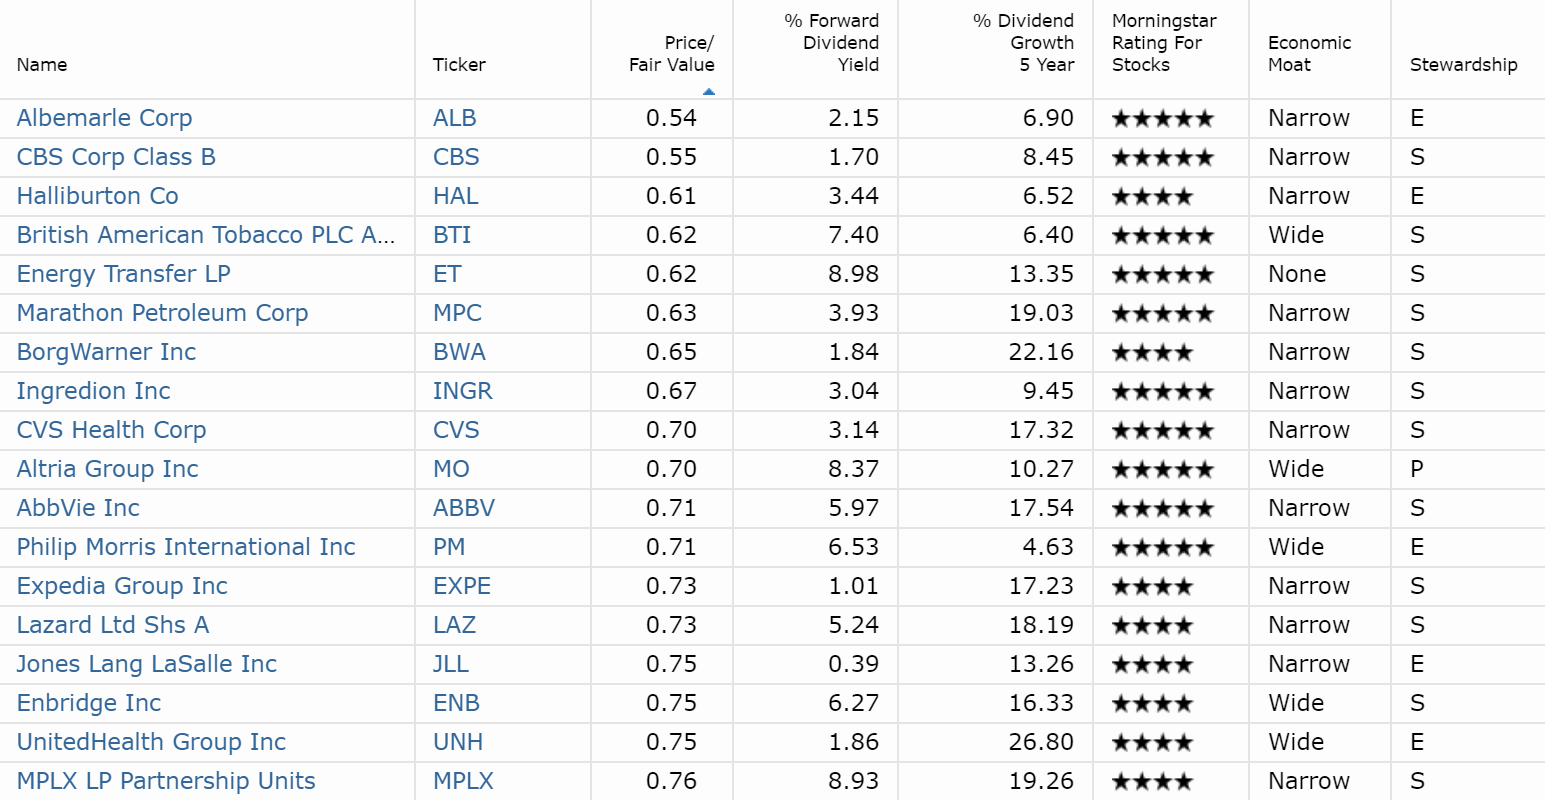
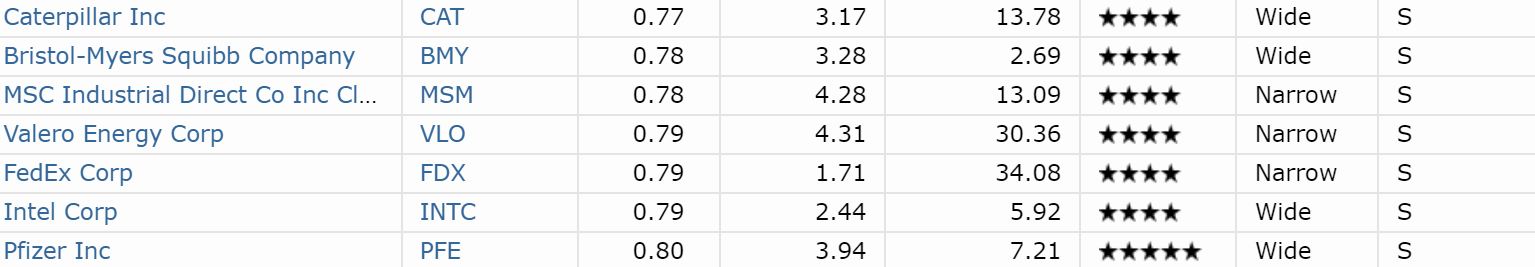
Even with the market near all-time highs, you can see that at least according to Morningstar there are plenty of quality names available at bargain prices.
But you can't just look at any one analyst's fair value estimate and know if it's a good buy. That's because every company has its own risk profile, and differing business models mean that a 20% discount to fair value of a highly cyclical company (like commodity producers) isn't the same for one with very stable and recession-resistant cash flow (like a consumer staples company).
This is where looking at Morningstar's star ratings is a good next step. These ratings, which correspond to Buy, Strong Buy, and Very Strong Buy recommendations, factor in a company's risk profile, industry trends, management quality, and Morningstar's definition of "Moatiness" (which I sometimes disagree with, but are for the most part on the money when it comes to corporations).
Morningstar's moat definition is based on their belief that a company can maintain returns on invested capital above its weighted cost of capital (using their assumptions plugged into the CAPM model) for 20 years or longer (wide moat) and 10 years or more (narrow moat). I look for competitive advantages that allow returns on invested capital above the industry norm and above the cash cost of capital (which matters more to the ability to grow dividends over time).
Here are my watch list companies that Morningstar considers 4- or 5-star Buys and Strong Buys.
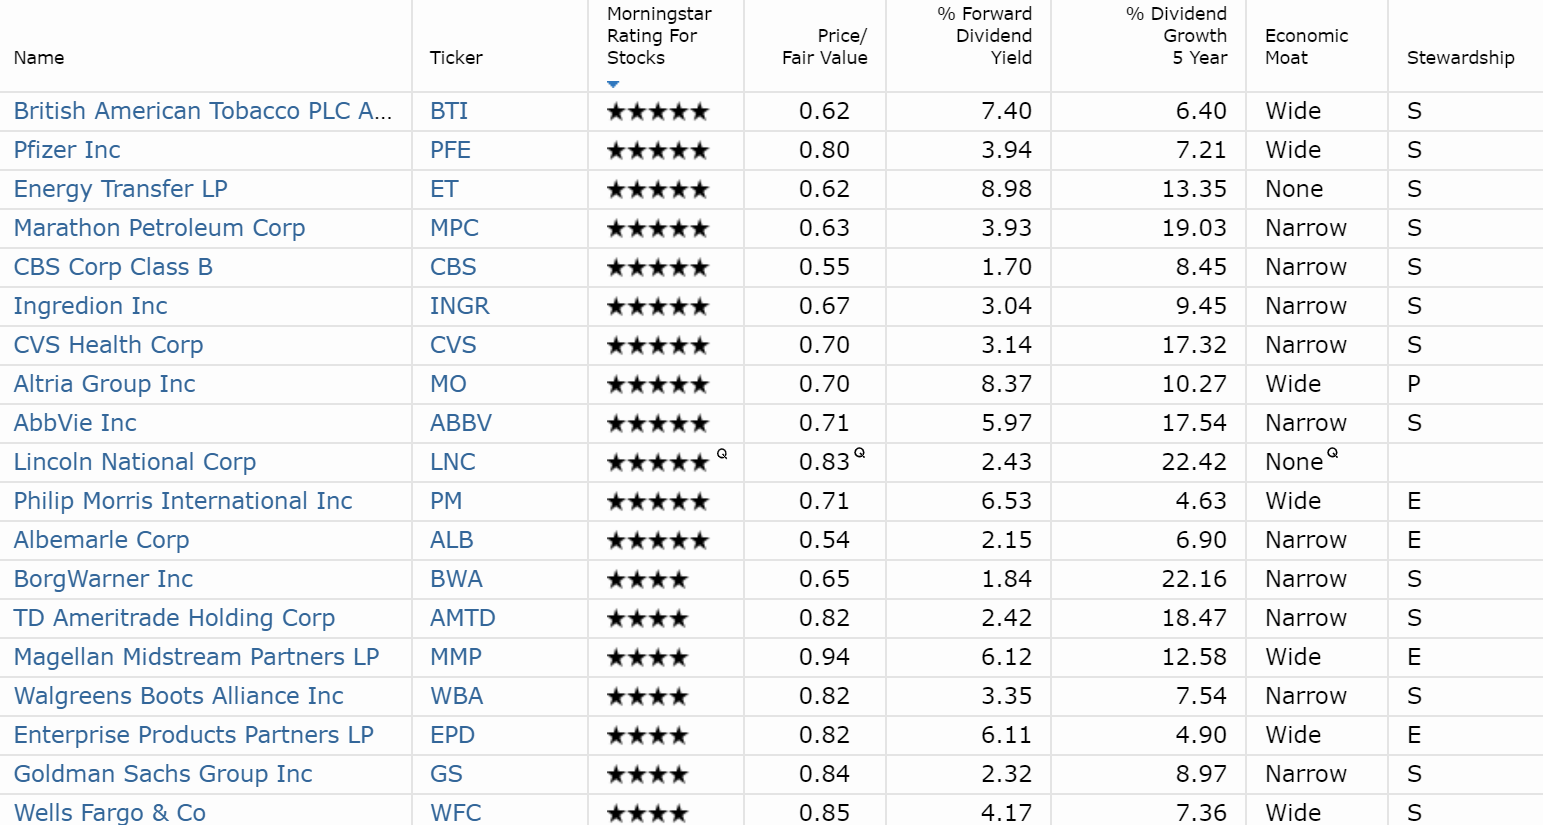
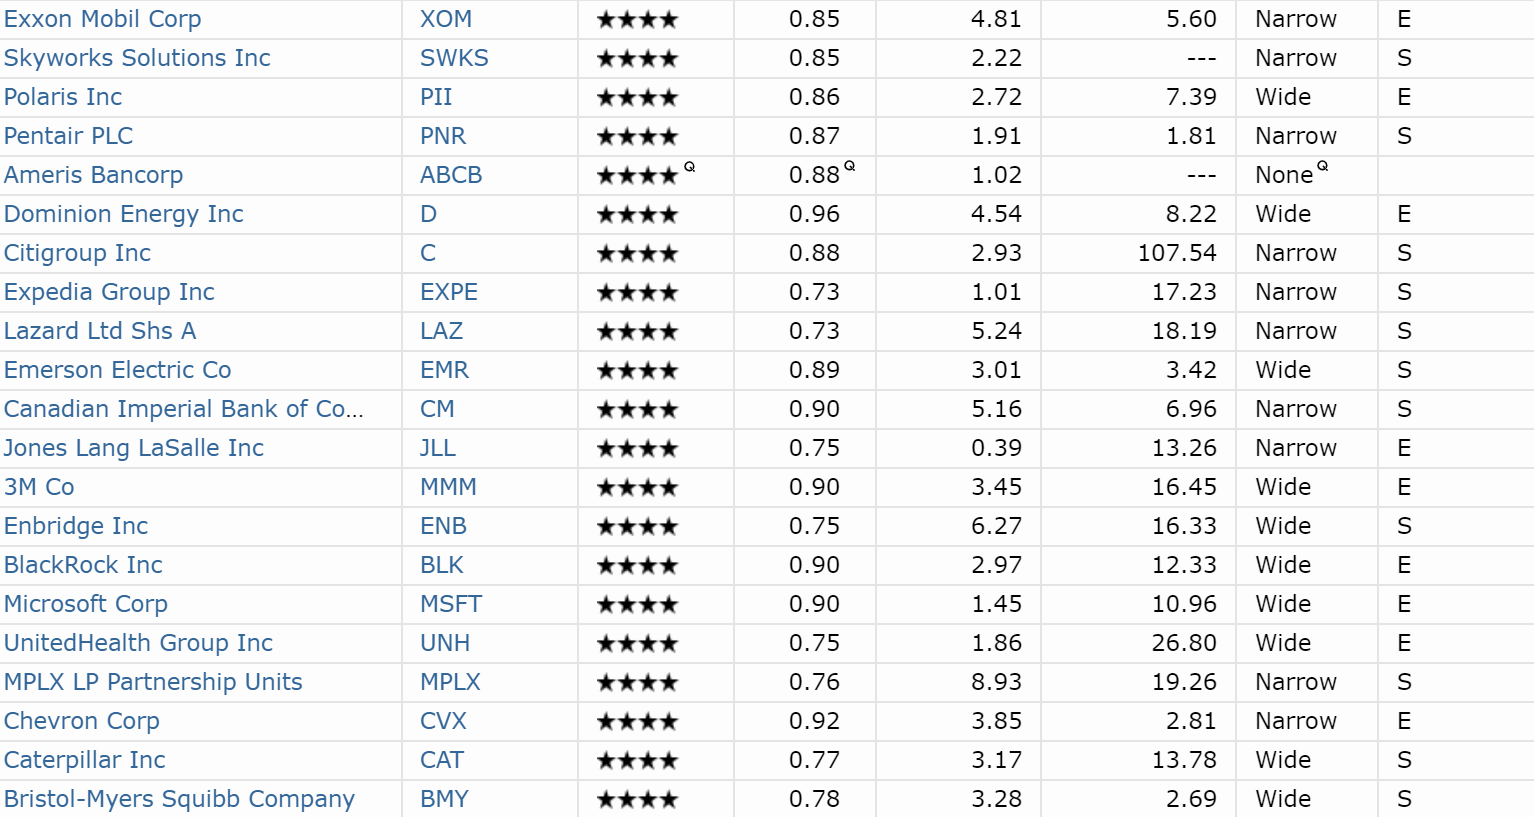
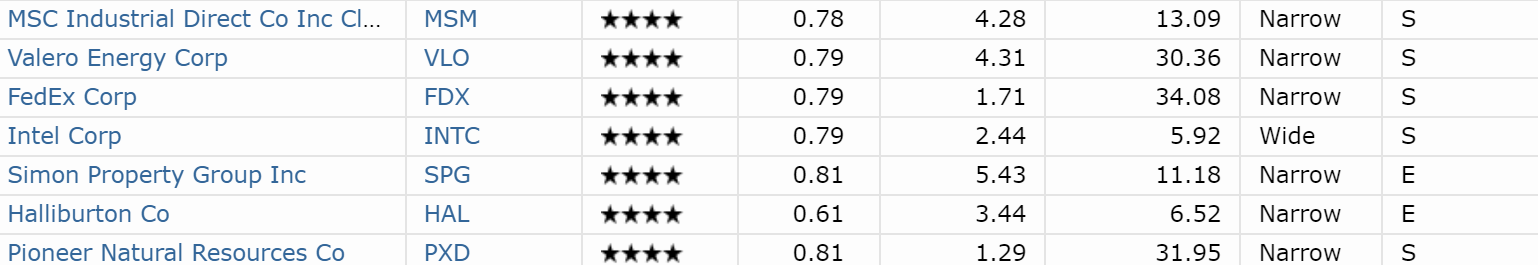
You'll note that there are a lot more 4- and 5-star stocks than ones trading 20% or below Morningstar's estimated fair value. That's because Morningstar is adjusting for quality, safety, and overall cash flow stability (via their uncertainty ratings). This is why Dominion Energy (D), the second best-regulated utility in America, is a 4-star stock, despite being just 4% undervalued per Morningstar's estimate.
However, while a 4- or 5-star Morningstar stock is usually a good long-term investment, it's important to remember that some of its recommendations can be far off the mark. Dividend Kings uses a 100% pure F.A.S.T. Graphs-powered historical valuation method that only looks at historical and objective data and sometimes disagrees with Morningstar.
Typically, these disagreements are minor. Sometimes, they are not. For example:
| Company | Morningstar Fair Value | Dividend King's Historical Fair Value |
| 3M (MMM) | $188 | $188 |
| Microsoft (MSFT) | $155 | $100 |
| Apple (AAPL) | $200 | $165 |
| Nike (NKE) | $98 | $66 |
| Home Depot (HD) | $170 | $199 |
| Simon Property Group (SPG) | $195 | $206 |
| UnitedHealth Group (UNH) | $310 | $214 in 2019 about $240 in 2020 |
Morningstar usually has similar estimates as us for most sectors, but for popular momentum stocks (like many tech names), they often appear to try to justify rich valuations. For example, they assume much faster growth at Microsoft which will justify a 40% multiple expansion, which implies that Microsoft's growth rate in the future will be 14% CAGR (not impossible, but on the upper range of probable).
For Nike, Morningstar straight up assumes a 55% increase of the historical P/E, despite growth rates that are merely in line with its historical norms.
We maintain our fair value estimate on Nike of $98. Our fair value estimate implies a fiscal 2020 adjusted P/E of 34 and a 2019 EV/adjusted EBITDA of 24.
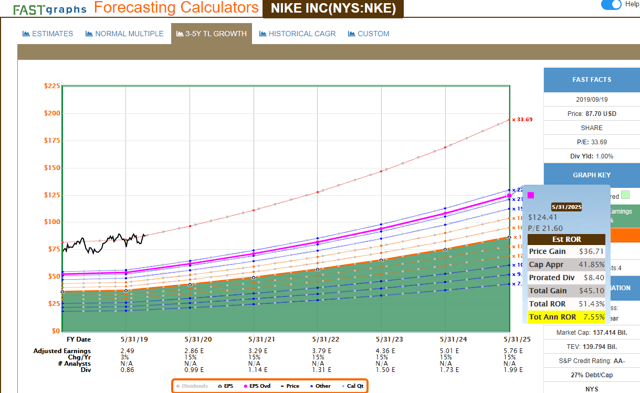
Over the past 20 years, Nike has grown earnings 14% CAGR and averaged a 21.7 PE. Analysts expect 15% CAGR growth which I consider reasonable. What's not reasonable is to assume similar growth and fundamentals will suddenly be valued at a 55% higher PE multiple.
Morningstar's analyst appears to like Nike, a red hot momentum stock. I love the business model and consider Nike a 11/11 quality SWAN stock, one of the best dividend growth companies on earth. But Morningstar is basically slapping the current PE on 2020 earnings estimates and saying it's a good buy today, implying about 16% CAGR total return potential over the next five years.
If the PE comes back to 21.7, the average over a period when fundamentals and growth were similar, Nike's 15% CAGR growth would translate into about 8% annual total returns or half what it would achieve if 34 really were an appropriate fair value PE.
Dividend Kings lines up realistic future growth rates (based on fundamentals, management guidance, and analyst consensus) with time periods in which the company's fundamentals and growth rates were similar to what's likely, and then assumes the same average valuation multiples will apply to this year's expected results (since the fundamentals and growth rates are similar).
This historical valuation approach, using several metrics, is what all the Dividend Kings have used for years or decades, and according to TipRanks, it's made us some of the best analysts in the country.
Note that we tend to be value-focused investors, highlighting unloved companies like Altria, AbbVie, Tanger, and Energy Transfer (among several MLPs that I've been recommending for years). 12-month forward returns aren't our goal, yet we are still managing to beat 99.4% of analysts at their short term, market timing, technical analysis chart focused game.
How can you tell whether Morningstar's fair value estimates are reasonable or just plain crazy? By looking at objective metrics, like P/E ratios.
Price-To-Earnings Vs. Historical Norm
While no single valuation method is perfect (which is why DK uses 10 of them), a good rule of thumb (from Chuck Carnevale, the SA king of value investing and founder of F.A.S.T. Graphs) is to try not to pay more than 15 times forward earnings for a company. That's the same rule of thumb that Ben Graham, the father of value investing, considered a reasonable multiple to pay for a quality company.
This is because P/E ratios are the most commonly used valuation metric on Wall Street, and 15.0 P/E being a reasonable price for quality companies is based on Mr. Carnevale's 50 years of experience in asset management valuing companies. He bases that on an earnings yield of 6.7% (inverse of a 15 P/E) being roughly equal to the 200-year return of the stock market.
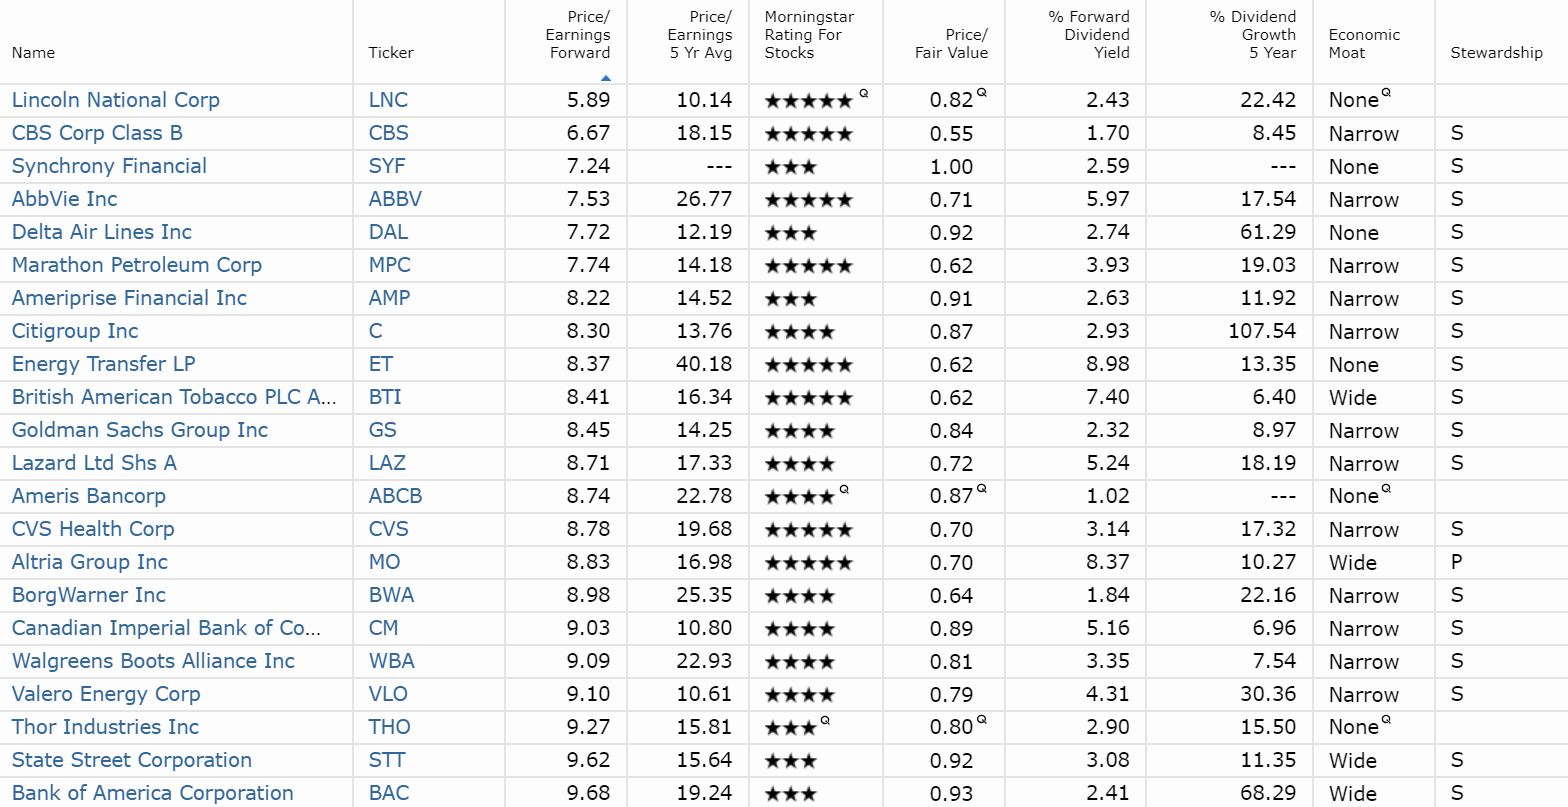
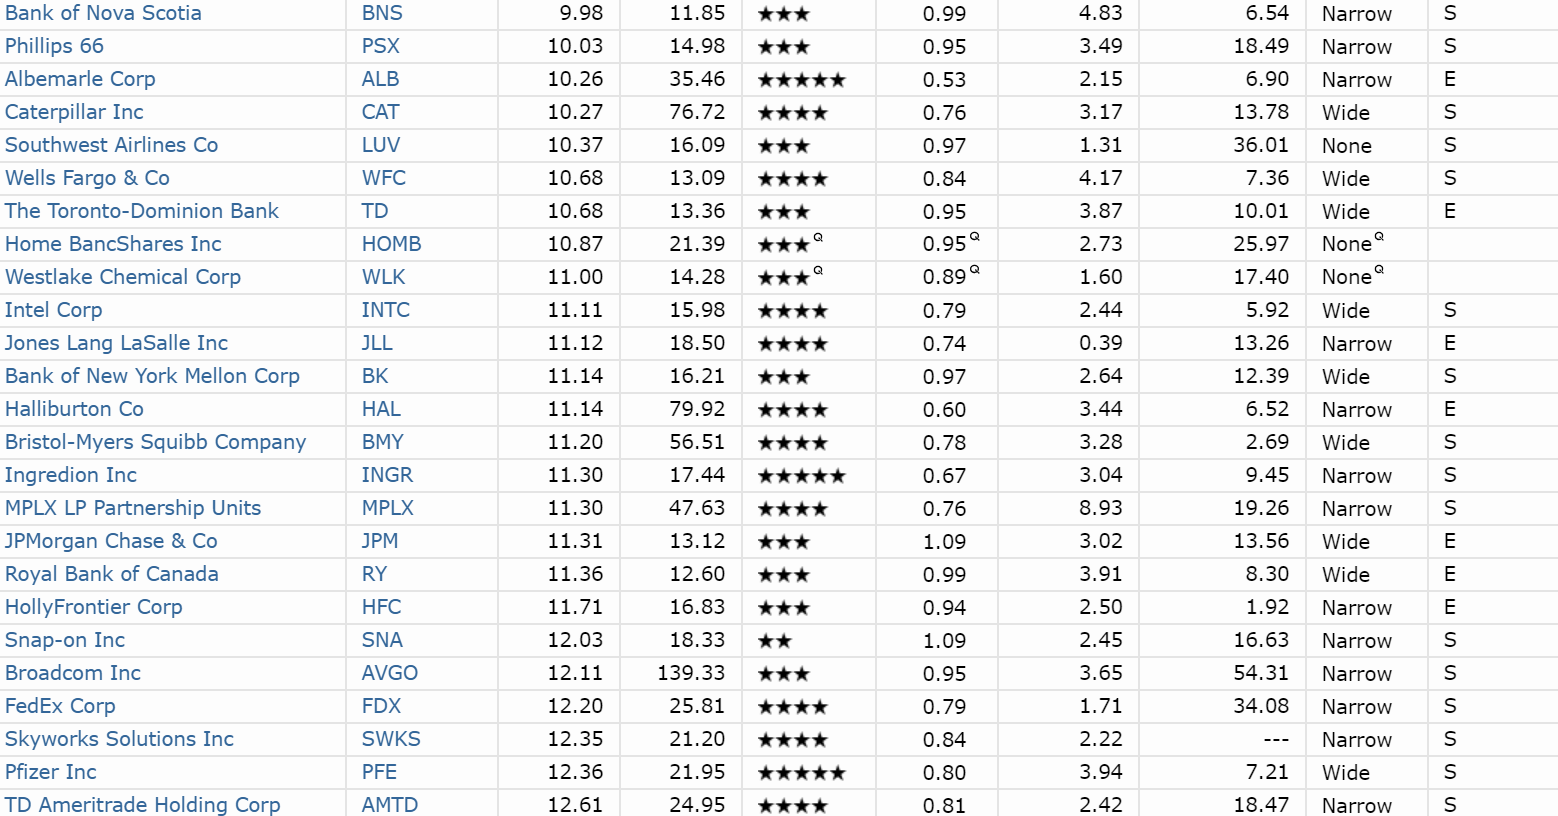
Here are dozens of blue-chip companies with forward P/Es of 15 or less and their five-year average P/Es. Note that some industries are naturally prone to lower multiples (such as financials) due to more cyclical earnings. Which is why you want to compare their current P/Es to their historical norms. (Morningstar offers 5-year average P/Es, but 10 years is better for factoring in industry/sector downturns.)
Keep in mind, P/E ratios for MLPs, REITs, and yieldCos are not a good indication of value, since high depreciation results in lower EPS. Price/cash flow is the better approach with such pass-through stocks.
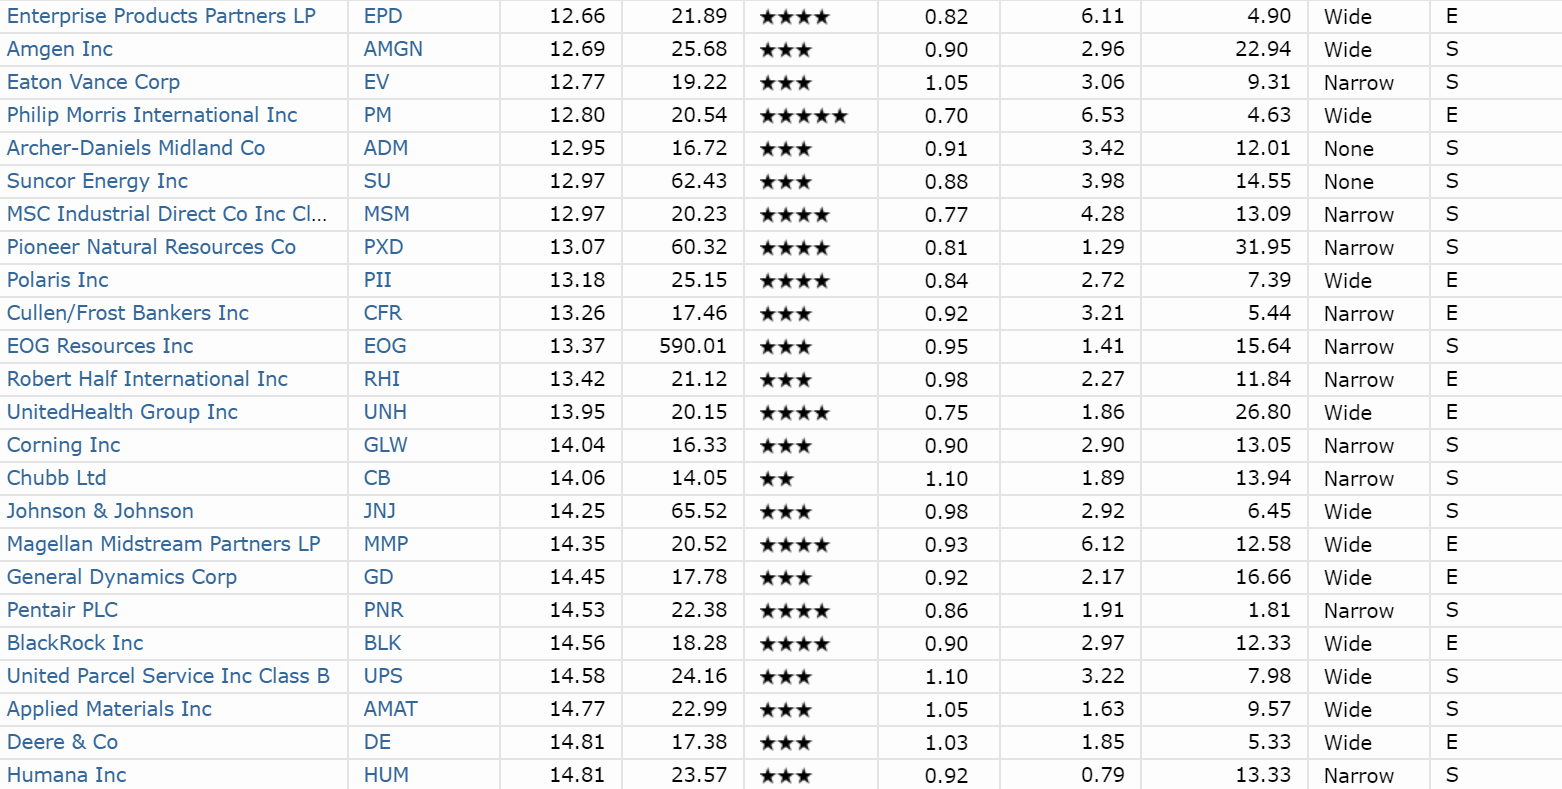
Historical P/E and a 15.0 rule of thumb are not perfect. 5-year average P/Es can give a false reading if something extreme happened, like a bubble or industry crash, causing the energy P/E ratio averages to become absurd.
This is why it's best to use the longest time period that corresponds to a company's expected growth rate. That will eliminate periods of short-term market insanity, such as when telecom tower REIT American Tower Corp. (AMT) traded at 86 times FFO in early 2000 (tech bubble). That stock fell 97% before bottoming in 2002 at a P/FFO of just 4, from which it then went on to deliver 29% CAGR total returns over the next 17 years.
This brings me to another important metric to check: price-to-cash flow, which replaces the P/E ratio for REITs, yieldCos, MLPs/midstreams, and many LPs.
Price-to-Cash Flow Vs. Historical Norm
While earnings are usually what Wall Street obsesses over, it's actually cash flow that companies run on and use to pay a dividend, repurchase shares, and pay down debt. Thus, the price-to-cash flow ratio can be considered a similar metric to the P/E ratio but a more accurate representation of a company's value. Chuck Carnevale also considers a 15.0 or smaller price-to-cash flow ratio to be a good rule of thumb for buying quality companies at a fair price. Buying a quality company at a modest-to-great cash flow multiple is a very high-probability long-term strategy.
Again, comparing a company's price-to-cash flow against its historical norm can tell you whether it's actually undervalued. Dividend Kings uses 10-year average cash flows, and Morningstar only offers 5-year averages. For cyclical companies, sometimes that can cause skewed results (which is why we use longer time periods and as many of our 10 valuation metrics as are industry-appropriate).
Here are all the companies on my watch list with price-to-cash flow of 15.0 or less.
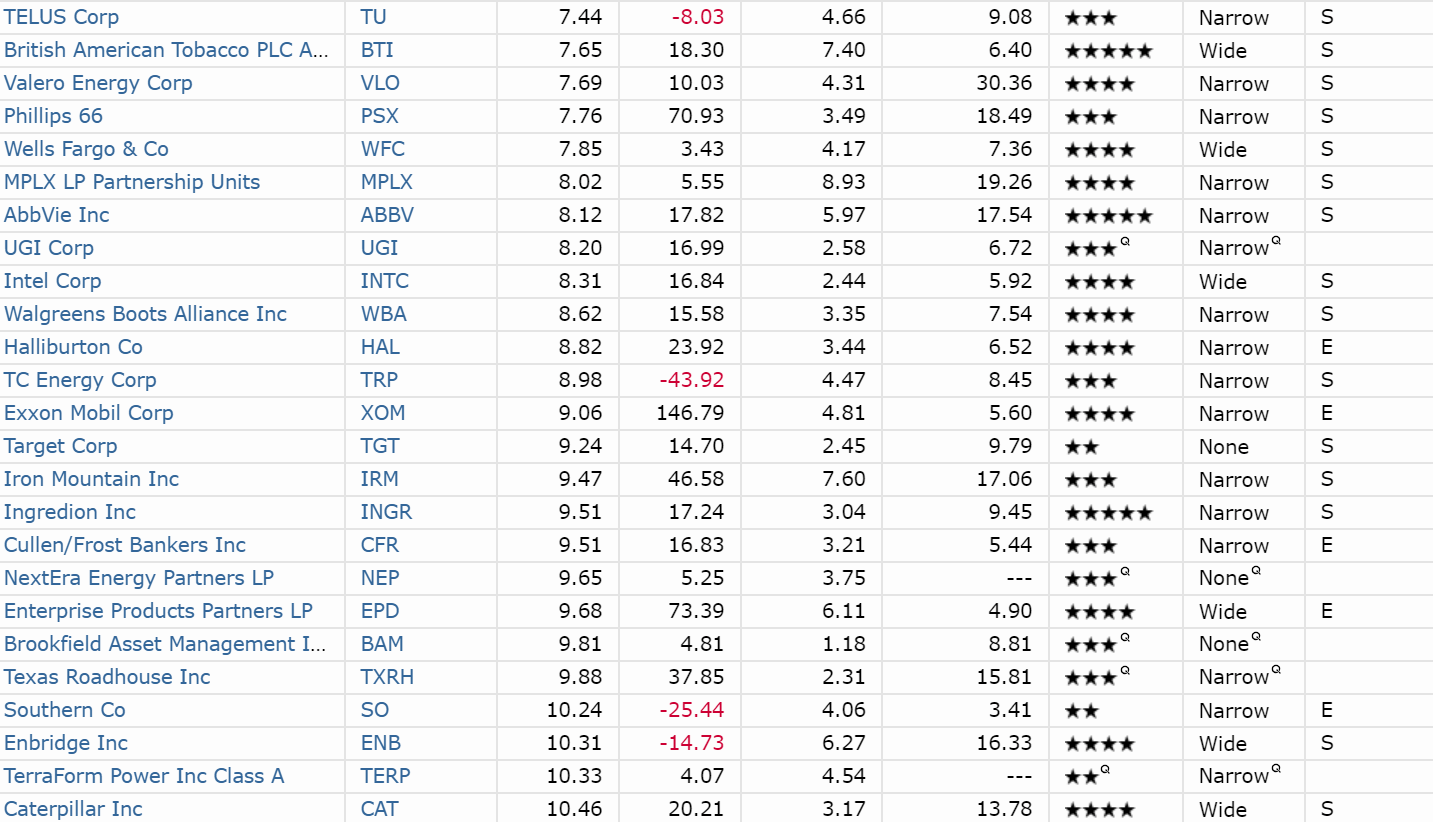
Again, historical price-to-cash flow estimates are not perfect. TerraForm Power (TERP), a level 8/11 quality yieldco, was run into the ground and nearly bankrupted by its former sponsor SunEdison (which did go bankrupt). Brookfield Asset Management rescued it and turned it into a great high-yield dividend growth stock, which justifies a much higher valuation (though it is about 20% overvalued today).
Another example of price to cash flow steering you wrong is Waste Management (WM). Waste Management is a great 9/11 quality blue chip. But in 2019, its fair value is about $75, and it's $115 today. That 53% overvaluation means -1% to 5% CAGR expected forward total returns over the next five years. Keep that in mind when you hear someone say "buy defensive ahead of a recession." While SOME undervalued defensive stocks (the VERY deep value ones) might go up in a recession (as occurred during the tech bubble crash) Waste Management's exposure to housing plus gross overvaluation might not make it as defensive as some investors expect.
You want to use several valuation metrics in concert to ensure that any false signals are eliminated (which is why DK uses up to 10). For example, both Philip Morris and AbbVie are trading at steep discounts to their historical price-to-cash flow multiples, and as you can see, Morningstar considers both to be 5-star buys today. (Dividend Kings agrees enthusiastically and has been steadily buying both for our portfolios.)
PE/Growth Ratio (Growth At A Reasonable Price) And Putting It All Together
According to Chuck Carnevale, a 15 P/E is prudent for most companies, even slow-growing ones. But if a company is able to grow especially fast (over 15% over time), it deserves a higher multiple. That's because the compounding power of time means a company that grows at a faster rate can generate many times greater wealth and income for you.
How Much Your Money Will Grow Based On Company Growth Rate And Time Period
| Long-Term Growth Rate | 10 Years | 20 Years | 30 Years | 40 Years | 50 Years |
| 5% | 1.6 | 2.7 | 4.3 | 7.0 | 11.5 |
| 10% | 2.6 | 6.7 | 17.5 | 45.3 | 117.4 |
| 15% | 4.0 | 16.4 | 66.2 | 267.9 | 1,084 |
| 20% | 6.2 | 38.3 | 237.4 | 1,470 | 9,100 |
| 25% | 9.3 | 86.7 | 807.8 | 7,523 | 70,065 |
| 30% | 13.8 | 190.0 | 2,620 | 36,119 | 497,929 |
| 35% | 20.1 | 404.3 | 8,129 | 163,437 | 3,286,158 |
| 40% | 28.9 | 836.7 | 24,201 | 70,038 | 20,248,916 |
| 45% | 41.1 | 1,688 | 69,349 | 2,849,181 | 117,057,734 |
| 50% | 57.7 | 3,326 | 191,751 | 11,057,332 | 637,621,500 |
Note that this table is simply meant to illustrate a point. It's not actually possible for any company to grow 50% annually for 50 years, which would mean earnings and cash flow growing nearly 1 billionfold (it would have to literally take over the world).
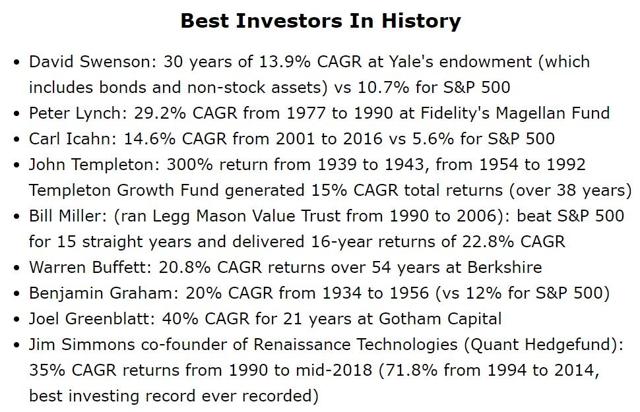
Most investors, depending on their needs (and ideal asset allocation), can likely achieve 5-10% returns over time. Warren Buffett is one of the greatest investors in history, with about 21% CAGR returns over 54 years.
Since 2000, the S&P 500's earnings growth has been about 6.5% CAGR, which is why a company that can realistically grow much faster may be worth a higher-than-normal P/E (or price-to-cash flow). This is where the PE/Growth or PEG ratio comes in.
While this method is limited by what growth assumptions you use, it's a quick and dirty way to screen for potentially attractive dividend growth investments when used in conjunction with other methods. The S&P 500's PEG ratio is currently 2.6-2.8 (depending on the growth estimates you use). A PEG of 1.0 or less is generally excellent.
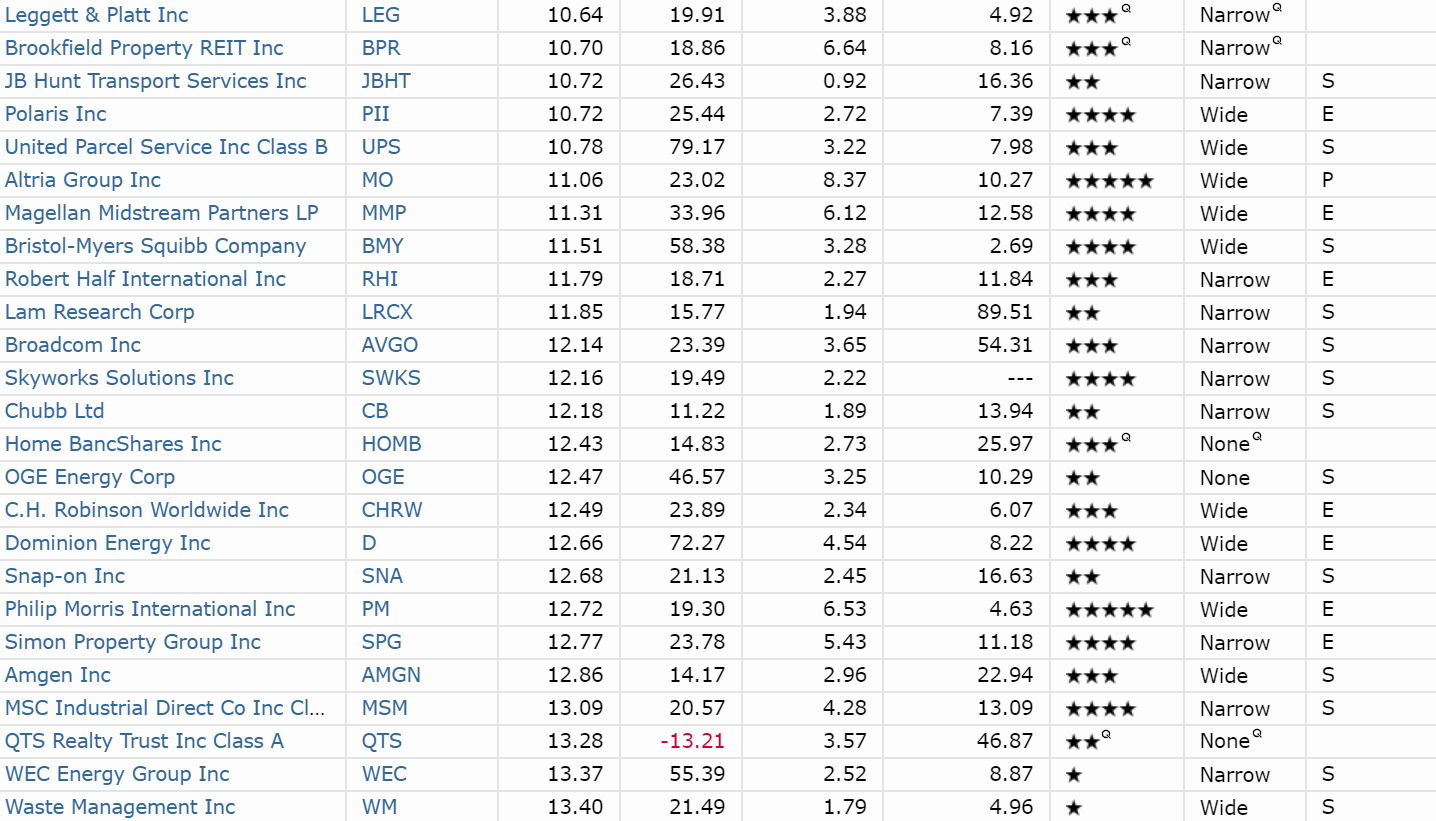
Here are my watch list stocks with PEGs of 1 or less, as estimated by Morningstar's forward growth forecast (some of those growth estimates are likely to be proven wrong).
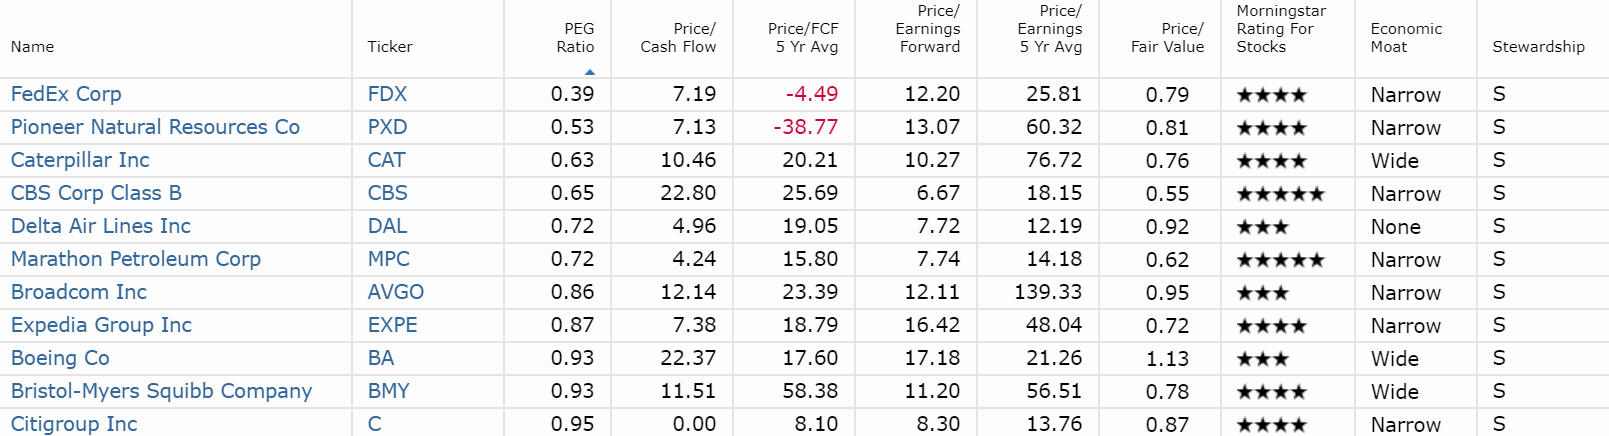
FedEx is a great company, trading at a nice discount, which is why Dividend Kings Deep Value portfolio bought it. But it's PEG is not 0.39, which implies about 20% long-term growth (9% to 14% is realistic). Based on the analyst consensus of 13% per FactSet Research, FDX's PEG is 0.81.
Citigroup's (C) PEG is indeed sub 1, with analysts expecting steadily improving cost-cutting and epic amounts of buyback to grow EPS at 15% CAGR over the next five years (doubling over that time).
Similarly, Broadcom, another of our 6 recommendations for the week, has a PE of about 13.5, vs 12.1% consensus growth. Its PEG is above one but just barely.
PEG is a good way to strive for "growth at a reasonable price", or GARP. However, the obvious flaw is that it's based on forward projections that can be wrong All valuation metrics have their limitations, which is why you shouldn't rely on just one.
Screening a company via all of these approaches can minimize the chances of overpaying for a quality name (make sure to check that earnings and cash flow are growing, so you don't buy a value trap by mistake).
For example, Altria clears nearly all these screens, making it a great deep value buy.
- Dividend King's Historical Discount To Fair Value: 36% (Very Strong Buy)
- Morningstar's estimated discount to fair value: 30%
- Morningstar's star rating: 5 (Strong Buy)
- PE: 9.7 (vs. 16.4 modern low-rate era average)
- Price-to-cash-flow: 9.3 vs. 18.5 historical average
- PEG: 1.2 (based on 8% CAGR analyst consensus for next five years)
On top of that, you get a generous 8.4% yield - most "high yield" funds and ETFs pay around 3%.
When you see all these valuation methods lining up and saying the same thing, that's when you can "bend it like Buffett" and back up the truck on a quality dividend blue chip, as I have been doing with Altria for several weeks.
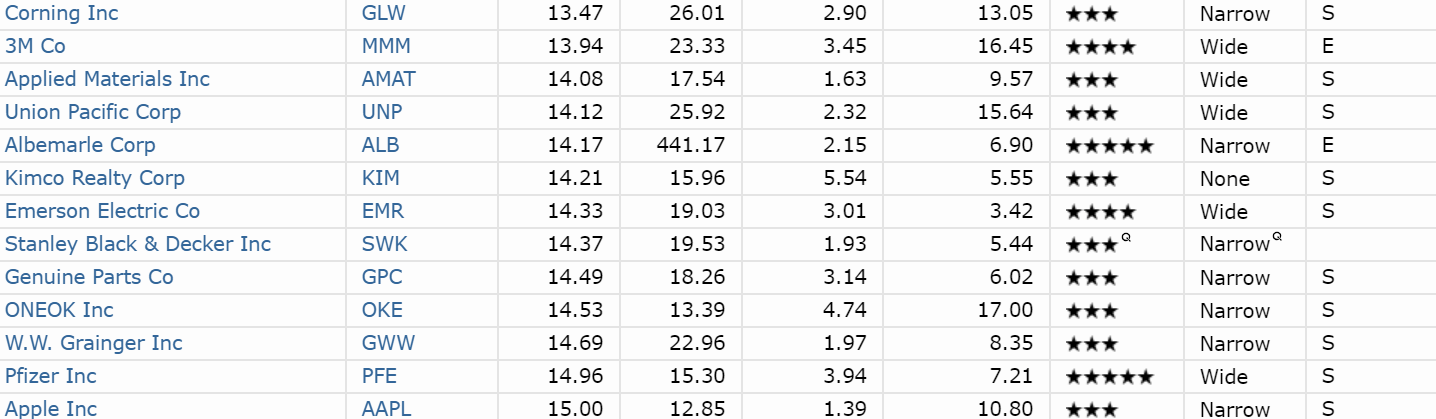
Quality Stocks At 52-Week Lows Are Great Screening Candidates
Dividend Kings' Deep Value portfolio doesn't primarily seek to buy companies at 52-week lows, but it's always nice to see companies make this list. That portfolio is designed to ferociously buy on crashes, which explains why we've recently been buying FedEx and Altria (Altria is owned in two of our portfolios, and we've been buying every week).
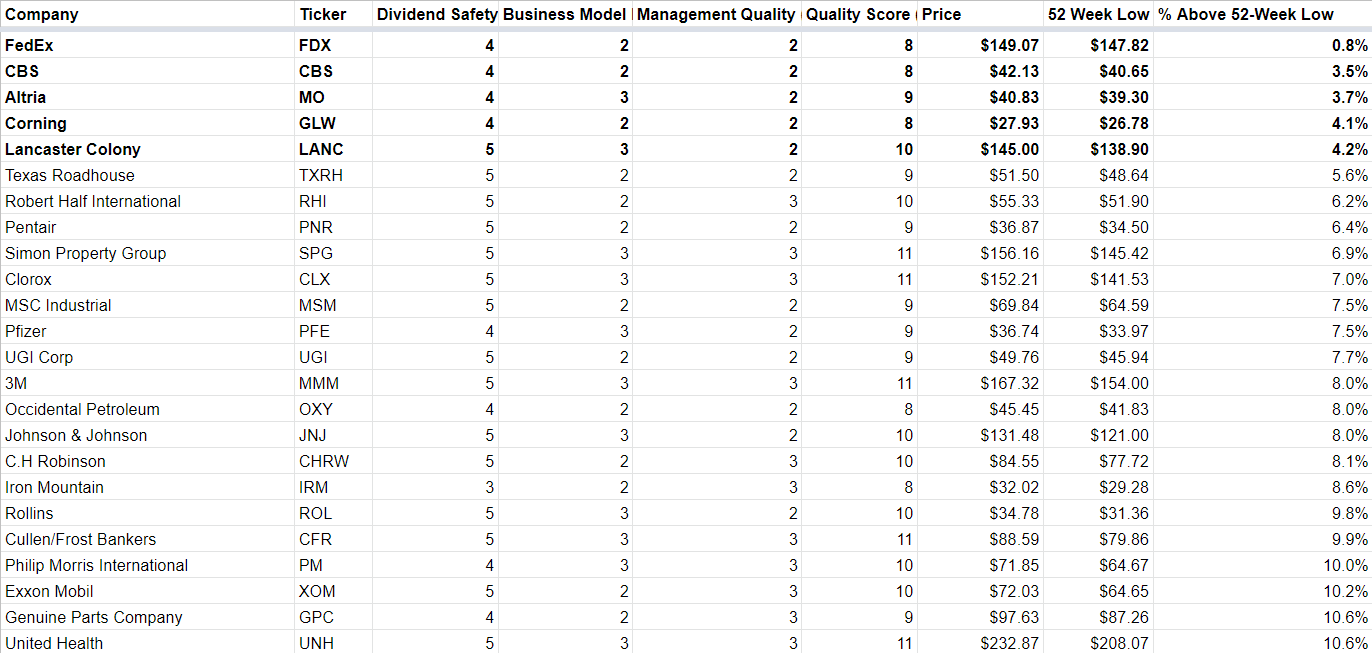
I maintain a watch list that takes every company I track and applies an 11-point quality score based on dividend safety, the business model, and management quality. All dividend stocks can be ranked 3-11, and my watch list (about 200 companies) only includes those with quality scores of 8 and higher.
- 8: Above-average quality company, seek 15% discount to fair value or better, limit to 5-10% of invested capital.
- 9: Blue-chip company, limit to 5-10% of invested capital and seek 10% discount to fair value.
- 10: SWAN stock, buy with confidence at 5% or greater discount to fair value or better, limit to 5-10% of invested capital.
- 11: Super SWAN (as close to an ideal dividend stock as you can find on Wall Street), fair value or better, limit to 5-10% of your invested capital.
A score of 7 is average quality, which means a 2% or smaller probability of a dividend cut during a recession, based on how much S&P 500 dividends have been cut in past economic downturns (2% was the highest average cut during the 1990 recession, all other recessions were less).
I've programmed that watch list to track prices and use the 52-week low as a means of knowing when a blue-chip or SWAN stock is within 5% of its 52-week low and, potentially, a Buffett-style "fat pitch" investment. This means a quality company is:
- Trading near its 52-week (or often multi-year) low
- Undervalued per other valuation methods
- Offers a high probability of achieving significant multiple expansion within 5-10 years, and thus delivering double-digit long-term total returns over this time period
Another method you can use is to target blue chips trading in protracted bear markets, such as sharp discounts to their 5-year highs. Buying a company at multi-year lows is another way to reduce the risk of overpaying and boost long-term total return potential.
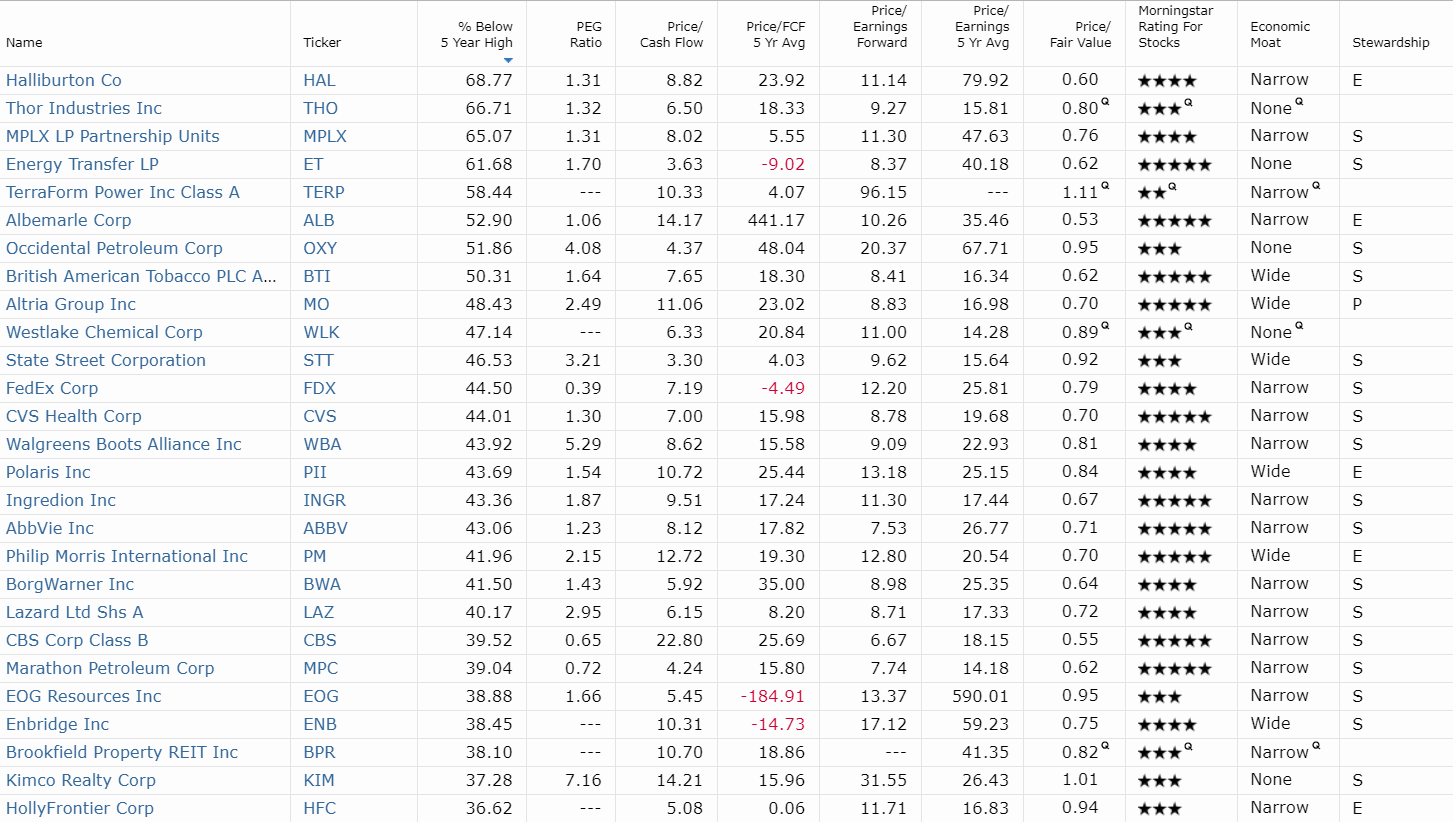
In the above table, I've set it up to show all the methods we've discussed today. You can thus see that most of the above companies are potentially fantastic long-term buys, based on many important valuation metrics, including Morningstar's qualitative ratings (of management quality, moat, and margin of safety).
This is what I mean by "fat pitch" investing - buying them when they are at their least popular ("Be greedy when others are fearful"). It doesn't mean buying some speculative, small company with an untested business model in hopes it becomes the next Amazon (AMZN).
The goal is simply to buy quality blue chips whose fundamentals are firmly intact, and whose valuations are so ridiculously low that modest long-term growth can deliver 15-25% CAGR total returns as the market realizes its mistake.
Mind you, it can take a long time for coiled springs like these deep value blue chips to pop (sometimes 5-10 years), but as long as their business models remain intact and they keep growing cash flow and dividends, they eventually will, which is why seven of the nine best investors in history have been value investors.
Bottom Line: Be Careful What You Wish For With Rate Cuts
Be very careful with the desire to see rate cuts drive a "there is no alternative" or TINA/rate cut euphoria rally. I like to say that
TINA is the devil. She'll tell you what you want to here and might make you feel good in the short-term, but rate cut euphoria rallies almost always inevitable end in tears."
Dividend Kings doesn't care about interest rates, because we are focused on buying quality dividend-paying companies at attractive to sensational valuations, and then letting competent management teams work hard to deliver
- growing cash flow overtimes
- growing dividends over time
- strong total returns courtesy of valuation mean reversion + inherent growth in fundamentals
The way I run the 4 dividend king model portfolios (Fortress, High-Yield Blue Chip, Deep Value Blue Chip and $1 Million Retirement) is the same as I handle my retirement portfolio where I keep 100% of my life savings.
- quality first (fundamentals are the only thing that matter in the long term)
- valuation second (always buy a quality company at a reasonable price or better)
- proper risk management always (Buffett's two rules of investing, rule #1 don't lose money, rule #2 never forget rule #1)
Interest rates, short-term market-moving news (Trump tweets an average of 12 times per day according to Bloomberg), and the media's incessant nattering about one risk or another do not factor into our equation.
Here are the facts:
- Bond market estimates about 38% probability of a recession starting within 12 months if current economic conditions persist (nothing ever stays exactly the same in the economy)
- the S&P 500 is about 7% historically overvalued based on forward PE
- the US economy is slowing down but unlikely to contract
- just 2 non-recessionary bear markets since 1945 meaning without recession only pullbacks and corrections are likely
As my fellow Dividend King Chuck Carnevale likes to say, "It's a market of stocks, not a stock market."
No matter how frothy the market gets, quality dividend blue chips will always be on sale. Heck during the tech bubble, Realty Income (O) hit an 11% yield and traded at 7 times FFO, vs. a 15 historical PE (it then more than doubled during the tech crash).
Today, Altria, AbbVie, and TELUS represent reasonable or exceptional high-yield defensive choices for conservative income investors fearful of recessions. Energy Transfer, FedEx, and Broadcom are all strong or very strong buys that have a bright future and should do very well in the next year if we avoid recession (62% probability of that).
