
Summary
- Today we're going to focus on mortgage REITs investors already missed the boat on.
- These mortgage REITs have a few things in common. They rallied dramatically and deserve a neutral rating after the huge returns they gave shareholders.
- In this series we're providing readers with the discounts to trailing book values throughout the sector and a few notes on the current environment.
- When we provide an index card for an individual mortgage REIT, it includes our most recent estimate on book values.
Following reader feedback, we've enhanced the layout for this series. Your continued feedback is greatly appreciated, so please leave a comment with suggestions.
This article will be heavy on charts because we like to communicate with images, rather than words, whenever possible. Likewise, we will use several tables to more efficiently structure the data. Enjoy!
Mortgage REITs and Preferred Shares
We've consistently incorporated a significant allocation to preferred shares in our portfolio. We could simply hold the positions for income, but we take advantage of trading opportunities as well. Our goal is to maximize total returns and this technique has worked wonderfully.
We also trade positions in the mortgage REIT common shares. We find this sector is particularly attractive because it can be so inefficient. Long term, share prices revolve around book value. In the short term, the price-to-book ratios can deviate materially. Simply by understanding that, you can put yourself in a better position.
Our other major source of allocations is equity REITs. While an investor might occasionally choose to trade an equity REIT position, the sector is a great fit for buy-and-hold investors.
We compare our performance against 4 ETFs that investors might use for exposure to our sectors:
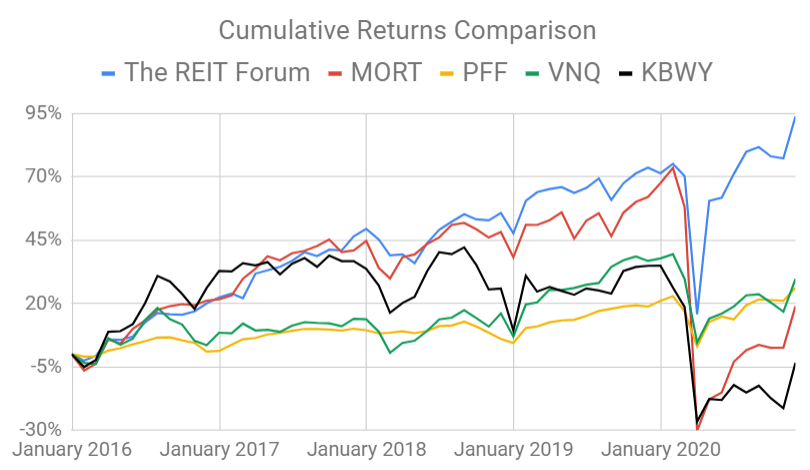
The 4 ETFs we use for comparison are:
Ticker | Exposure |
One of the largest mortgage REIT ETFs | |
One of the largest preferred share ETFs | |
Largest equity REIT ETF | |
The high-yield equity REIT ETF. Yes, it has been dreadful. |
When investors think it isn't possible to earn solid returns in preferred shares or mortgage REITs, we politely disagree. The sector has plenty of opportunities, but investors still need to be wary of the risks. We can't simply reach for yield and hope for the best. When it comes to common shares, we need to be even more vigilant to protect our principal by regularly watching prices and updating estimates for book value and price targets.
Mortgage REITs
Mortgage REITs | |||||||
Agency | Hybrid | Multipurpose | ETFs | ||||
$15.62 | $2.53 | $3.83 | $31.70 | ||||
$3.72 | $10.91 | $9.55 | $16.83 | ||||
$11.29 | $15.00 | $17.86 | |||||
$9.49 | $3.44 | ||||||
$6.04 | $3.88 | ||||||
$18.16 | $3.40 | ||||||
$8.35 | $3.56 | ||||||
$5.44 | |||||||
$6.70 | |||||||
Getting Neutral
You probably don't read every article I publish. That's fair. You probably see most articles across Seeking Alpha touting something to buy. We're going a different route and telling you things that you missed the opportunity to buy. Why is that important? Because many investors like to chase stocks that have already roared dramatically higher. In October we still often heard people saying that book value didn't matter (wrong) and that there was no catalyst for them to move higher (wrong, being dramatically undervalued is its own catalyst). We're going to give you a current index card and a few sentences on our thoughts. Here we go:
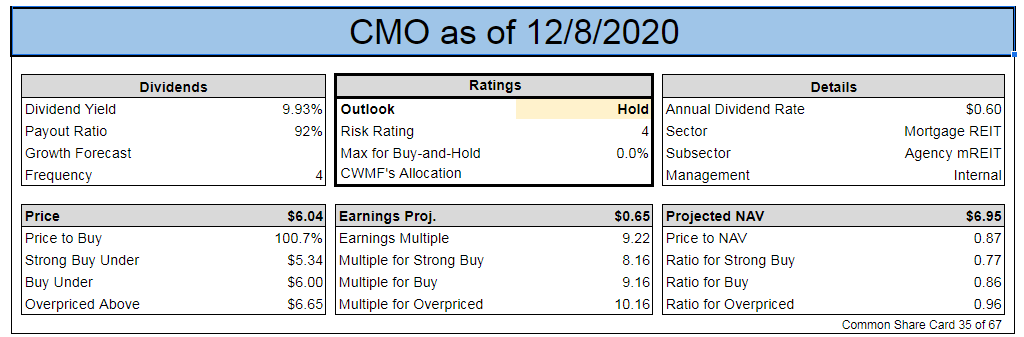
Price to book is only .87. This is more attractive than some peers, but less than others. Not a bad deal, but not an incredible deal either. CMO would like to see a steeper yield curve with higher interest rates on 30-year fixed-rate mortgages. That would reduce refinancing and in turn reduce the amortization of the premiums they pay to buy agency ARMs (adjustable-rate mortgages).
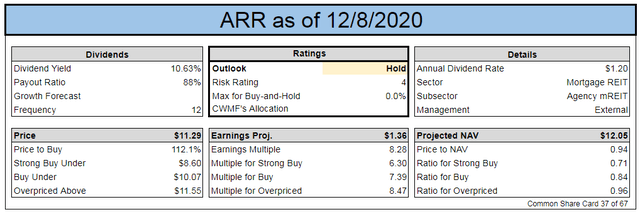
ARR is much deeper in the neutral range than CMO. For ARR, the price-to-book is closer to .94. Remember, these figures are based on our recent estimates of book value. Want the same math using trailing book values? I provide huge charts of that math further down in the article. We don't see a reason for ARR to have a price-to-book around .94. That's higher than AGNC or NLY and only slightly below DX. Not feeling it for ARR. We are neutral, but getting closer to the top of that range.
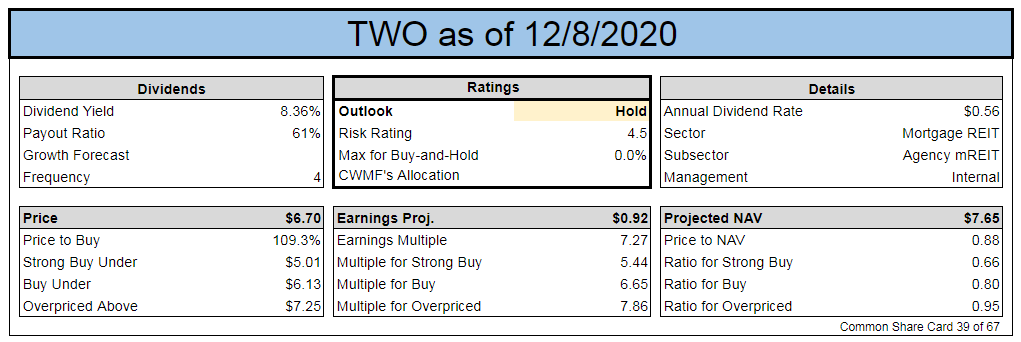
TWO delivered a great Q3 earnings report. We expected it to be great, but the market was apparently expecting it to be dreadful. That's just an example of how the market can ignore things that are blatantly stated in the Q2 earnings release, Q2 earnings presentation and Q2 earnings call. When management announces values in line with what they foreshadowed in the Q2 material, the market gets excited. Way to go market, you totally didn't fail at recognizing the value months earlier.
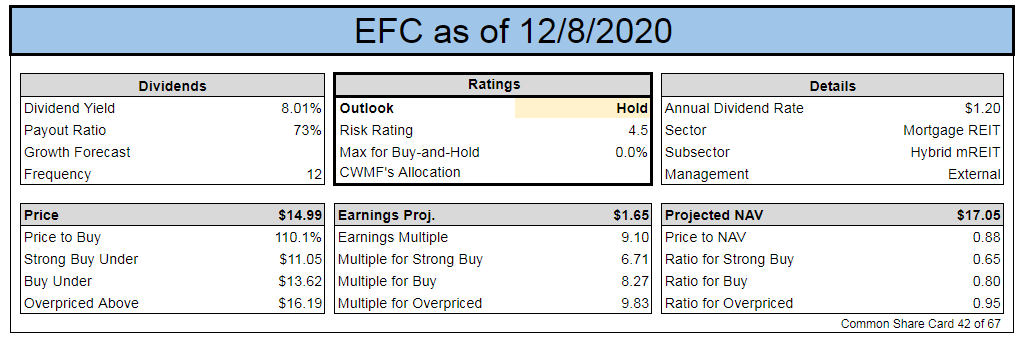
EFC gets a neutral outlook as well. They're an okay mortgage REIT. They trade around the middle of the neutral range, so this is about as neutral as we could get. No excitement here. It's okay, but there are several other options to consider.
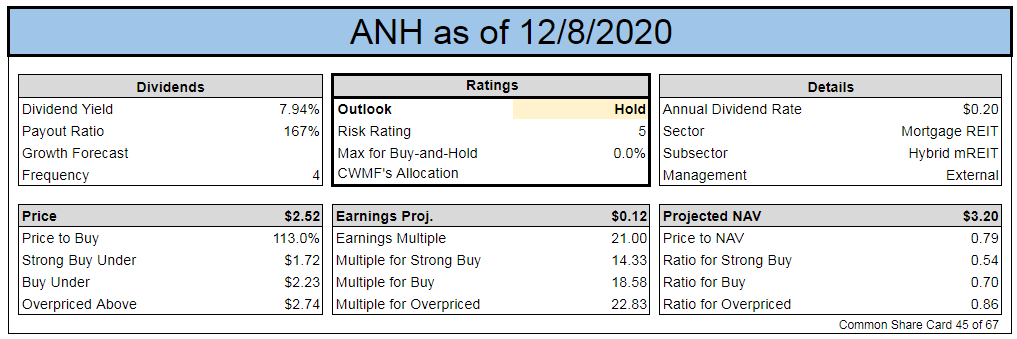
ANH announced a buyout. Well, it's about time. Shares have traded at a massive discount to NAV for a long time. Glad to see it finally happening. We've been hinting that mortgage REITs at the largest discounts to book value should be looking for offers to buy the entire REIT.
Price-to-Book Value - Using Q3 2020 Book Value
All the mortgage REITs within our batch have reported their Q3 2020 earnings, so we have trailing book values for all of them.
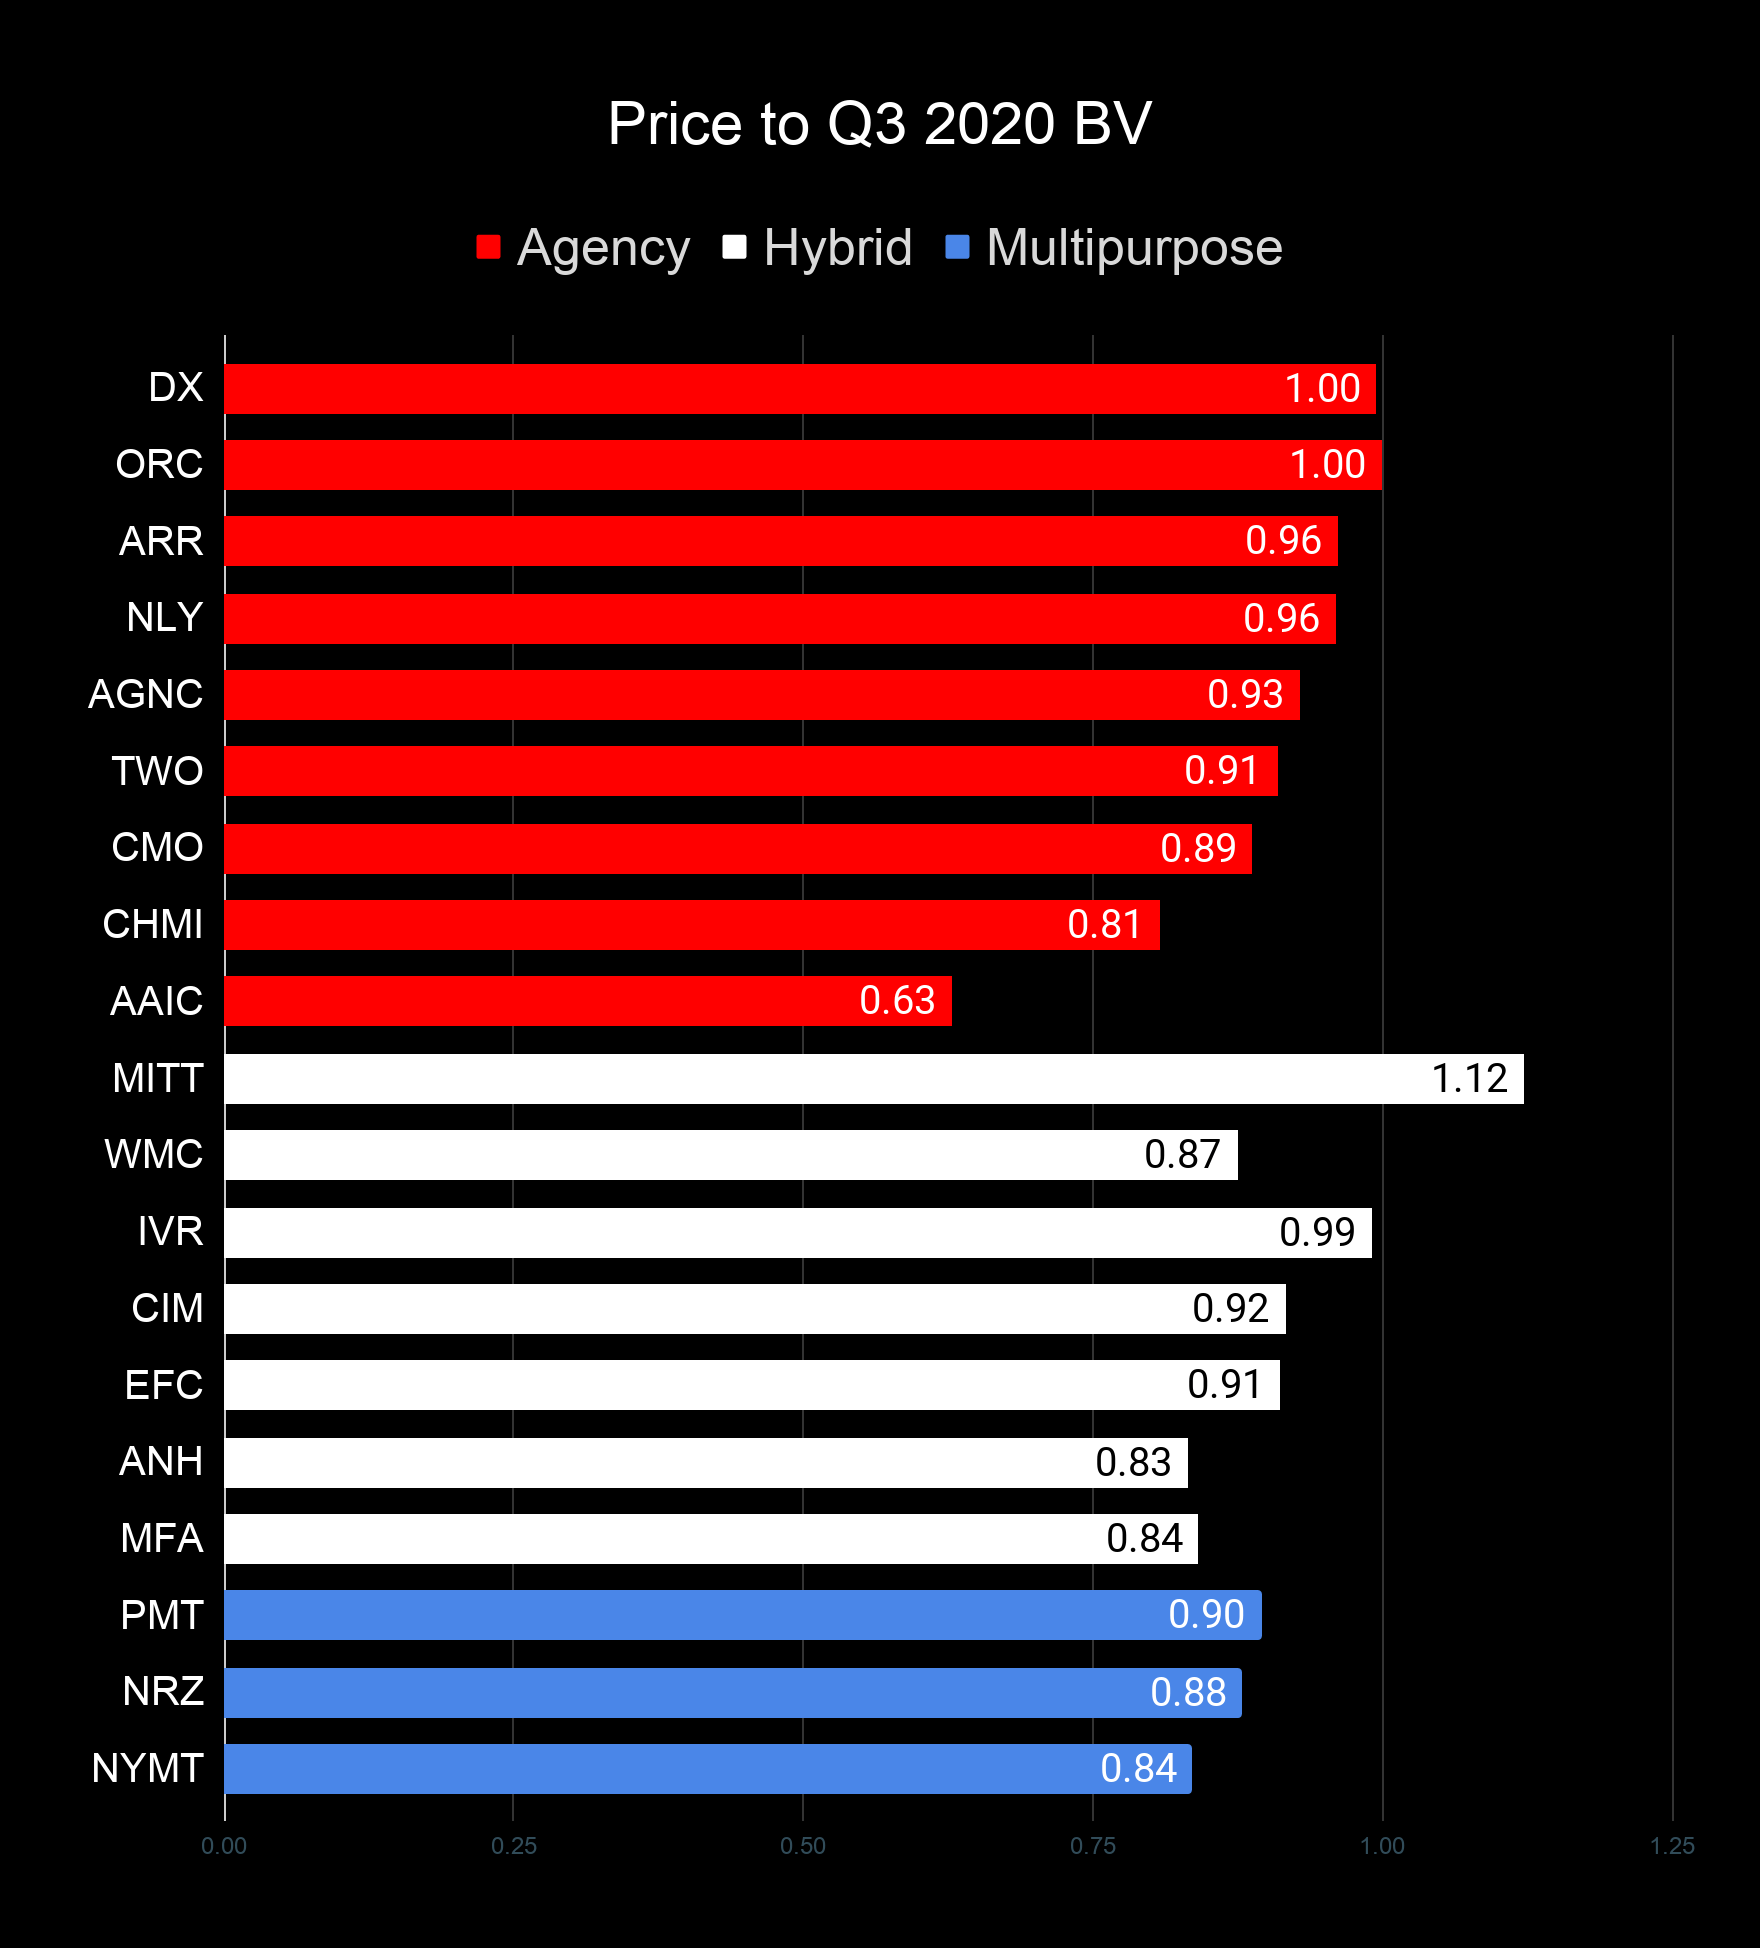
Remember that these are price-to-trailing-book ratios. They are not using estimates of current book value. Book values have changed during Q3 2020 and to a lesser degree during Q4 2020.
Repeated Note: There are two mortgage REITs we need to highlight here:
- AG Mortgage Investment Trust - We are using the Q3 2020 book value reported by management, which does not deduct the value of accrued dividends for preferred shares. If the preferred dividends were paid, it would reduce common book value under these calculations. This method is accepted under GAAP.
- MFA Financial reports "GAAP book value" and "economic book value". We've chosen to use the GAAP book value to remain consistent.
Unfortunately, we have to repeat those bullet points every time we publish because it regularly comes up if we don't mention it.
Book values will have changed some already during Q4 2020. We aren't including that in our public articles (except for index cards). Scott Kennedy provides frequent updates on estimated book value, ratings, and price targets through The REIT Forum.
Dividend Yields
Dividend yield often comes up in the comments, but picking based on dividend yield is stupid and regularly results in terrible performance. Don't do it.
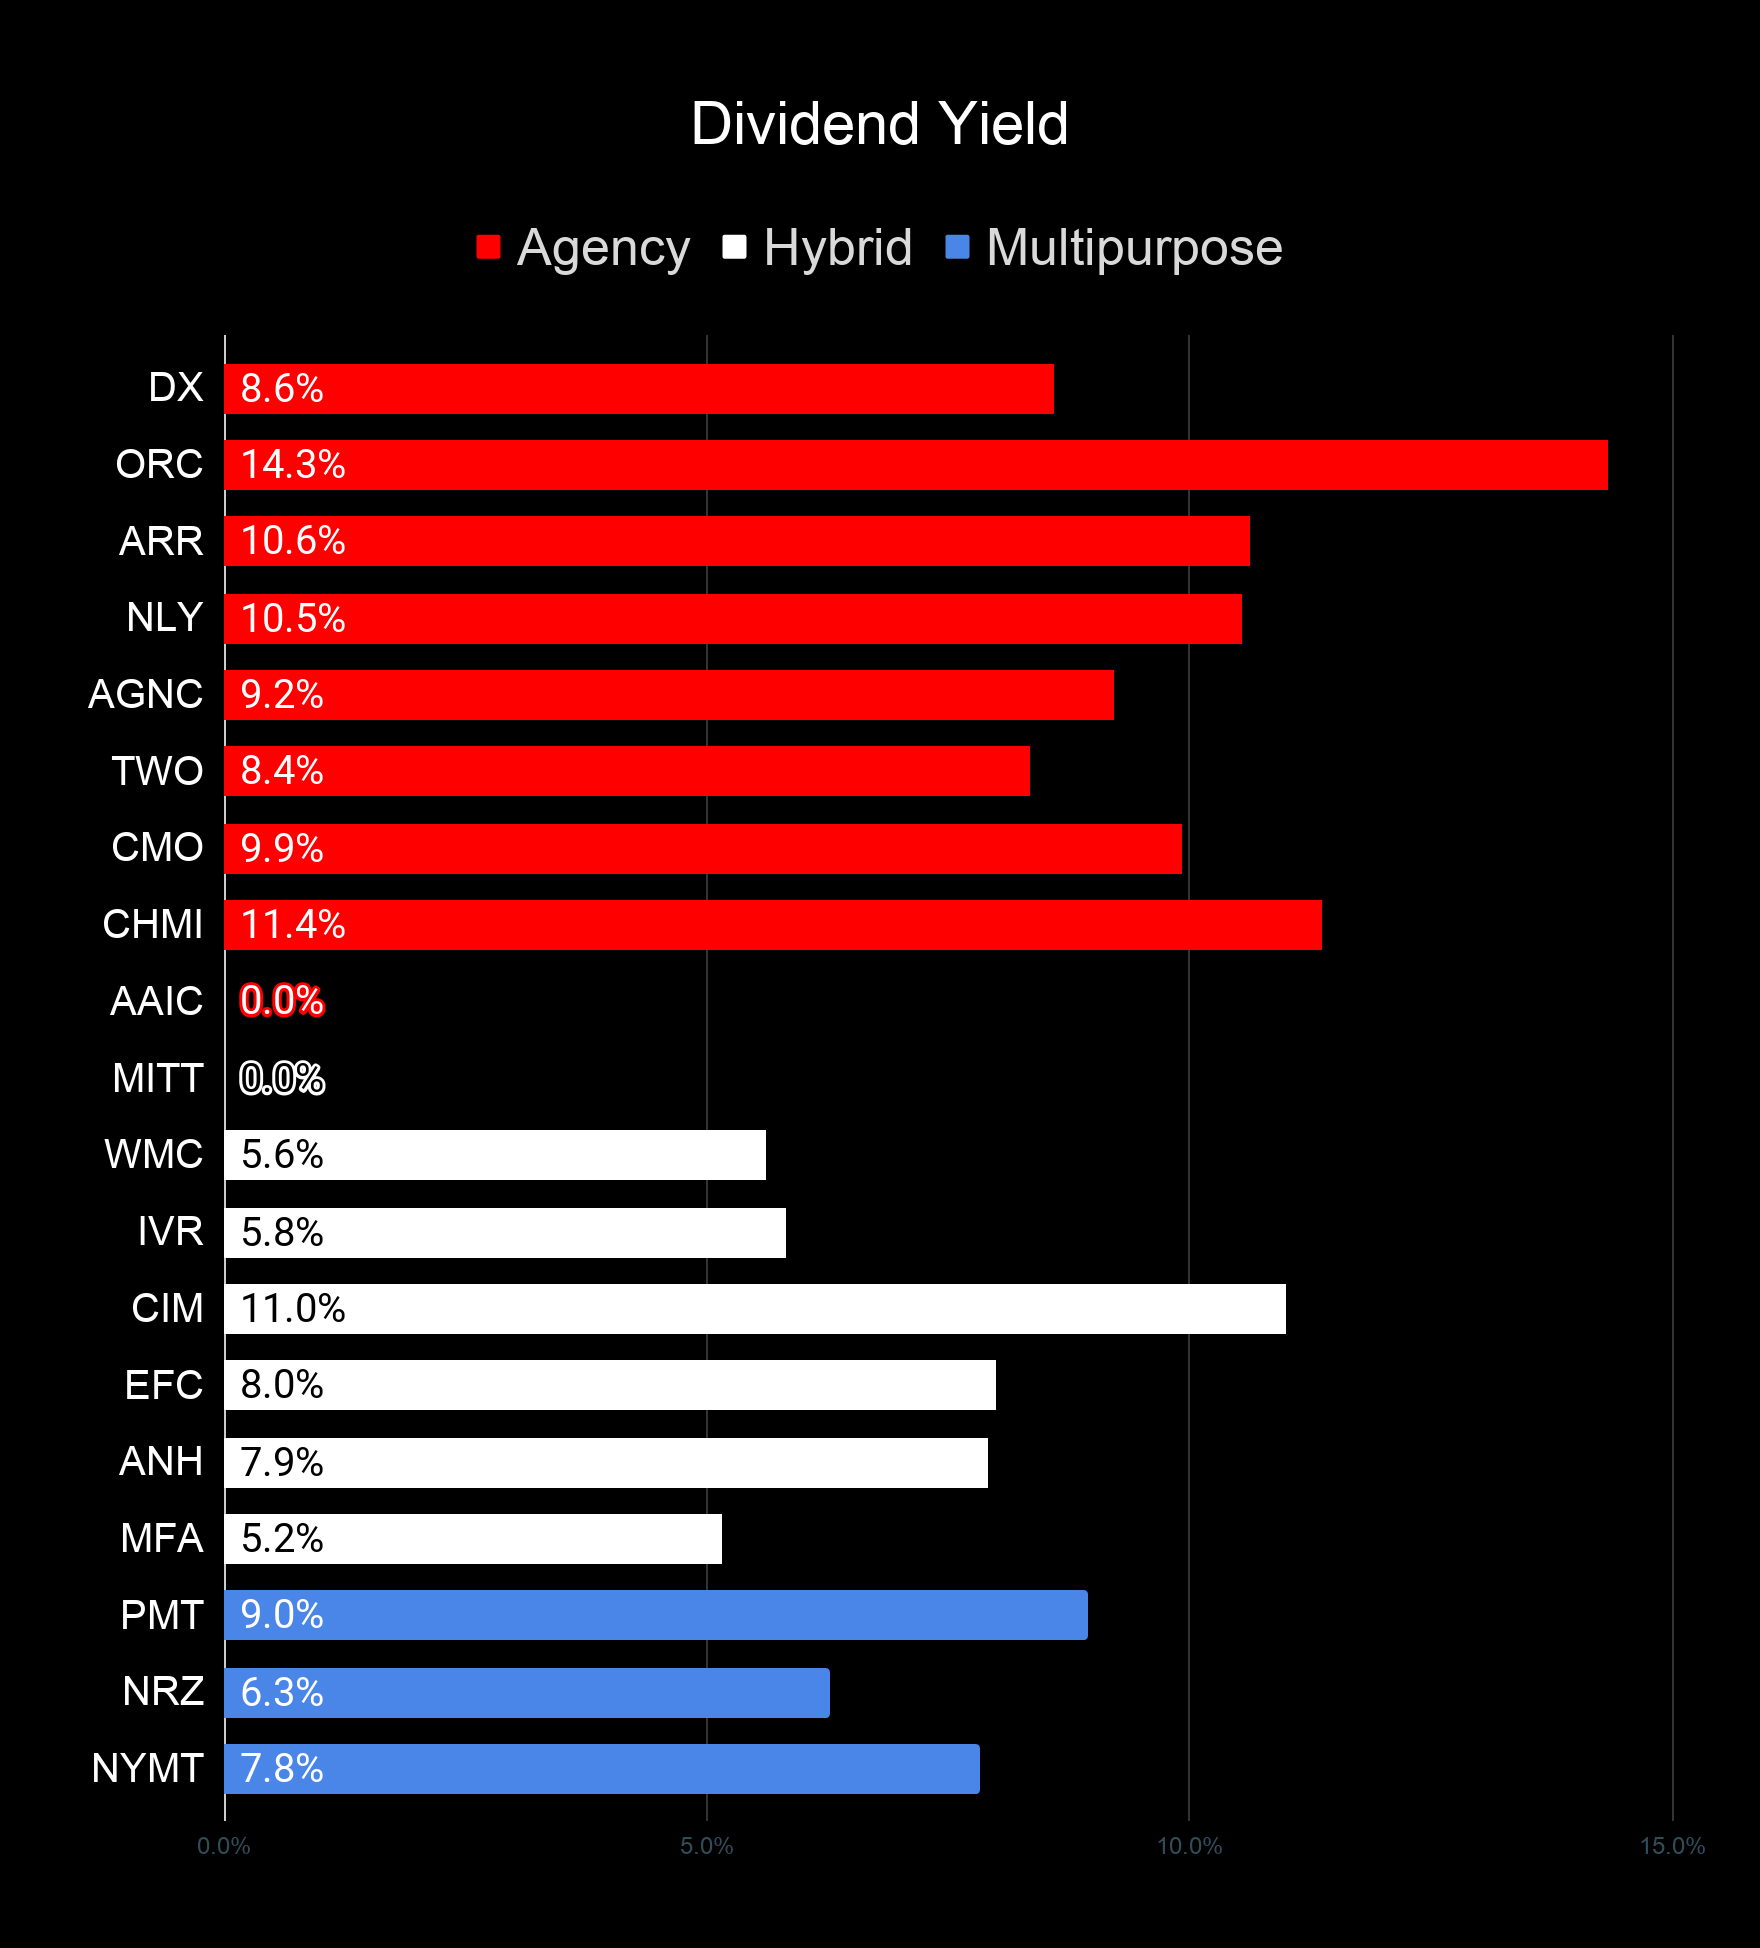
This chart is still in the same order as the prior charts. Consequently, you know the highest price-to-book ratios (using trailing GAAP book value) for each segment will be at the top. If you see a mistake, please feel free to say something. Occasionally the data for dividend rates requires a manual update.
Earning Yields
One of the next things investors may ask about is the yield using core earnings. This chart puts together the core earnings based on the consensus analyst estimate. Beware that the consensus estimate may not always be the best estimate.
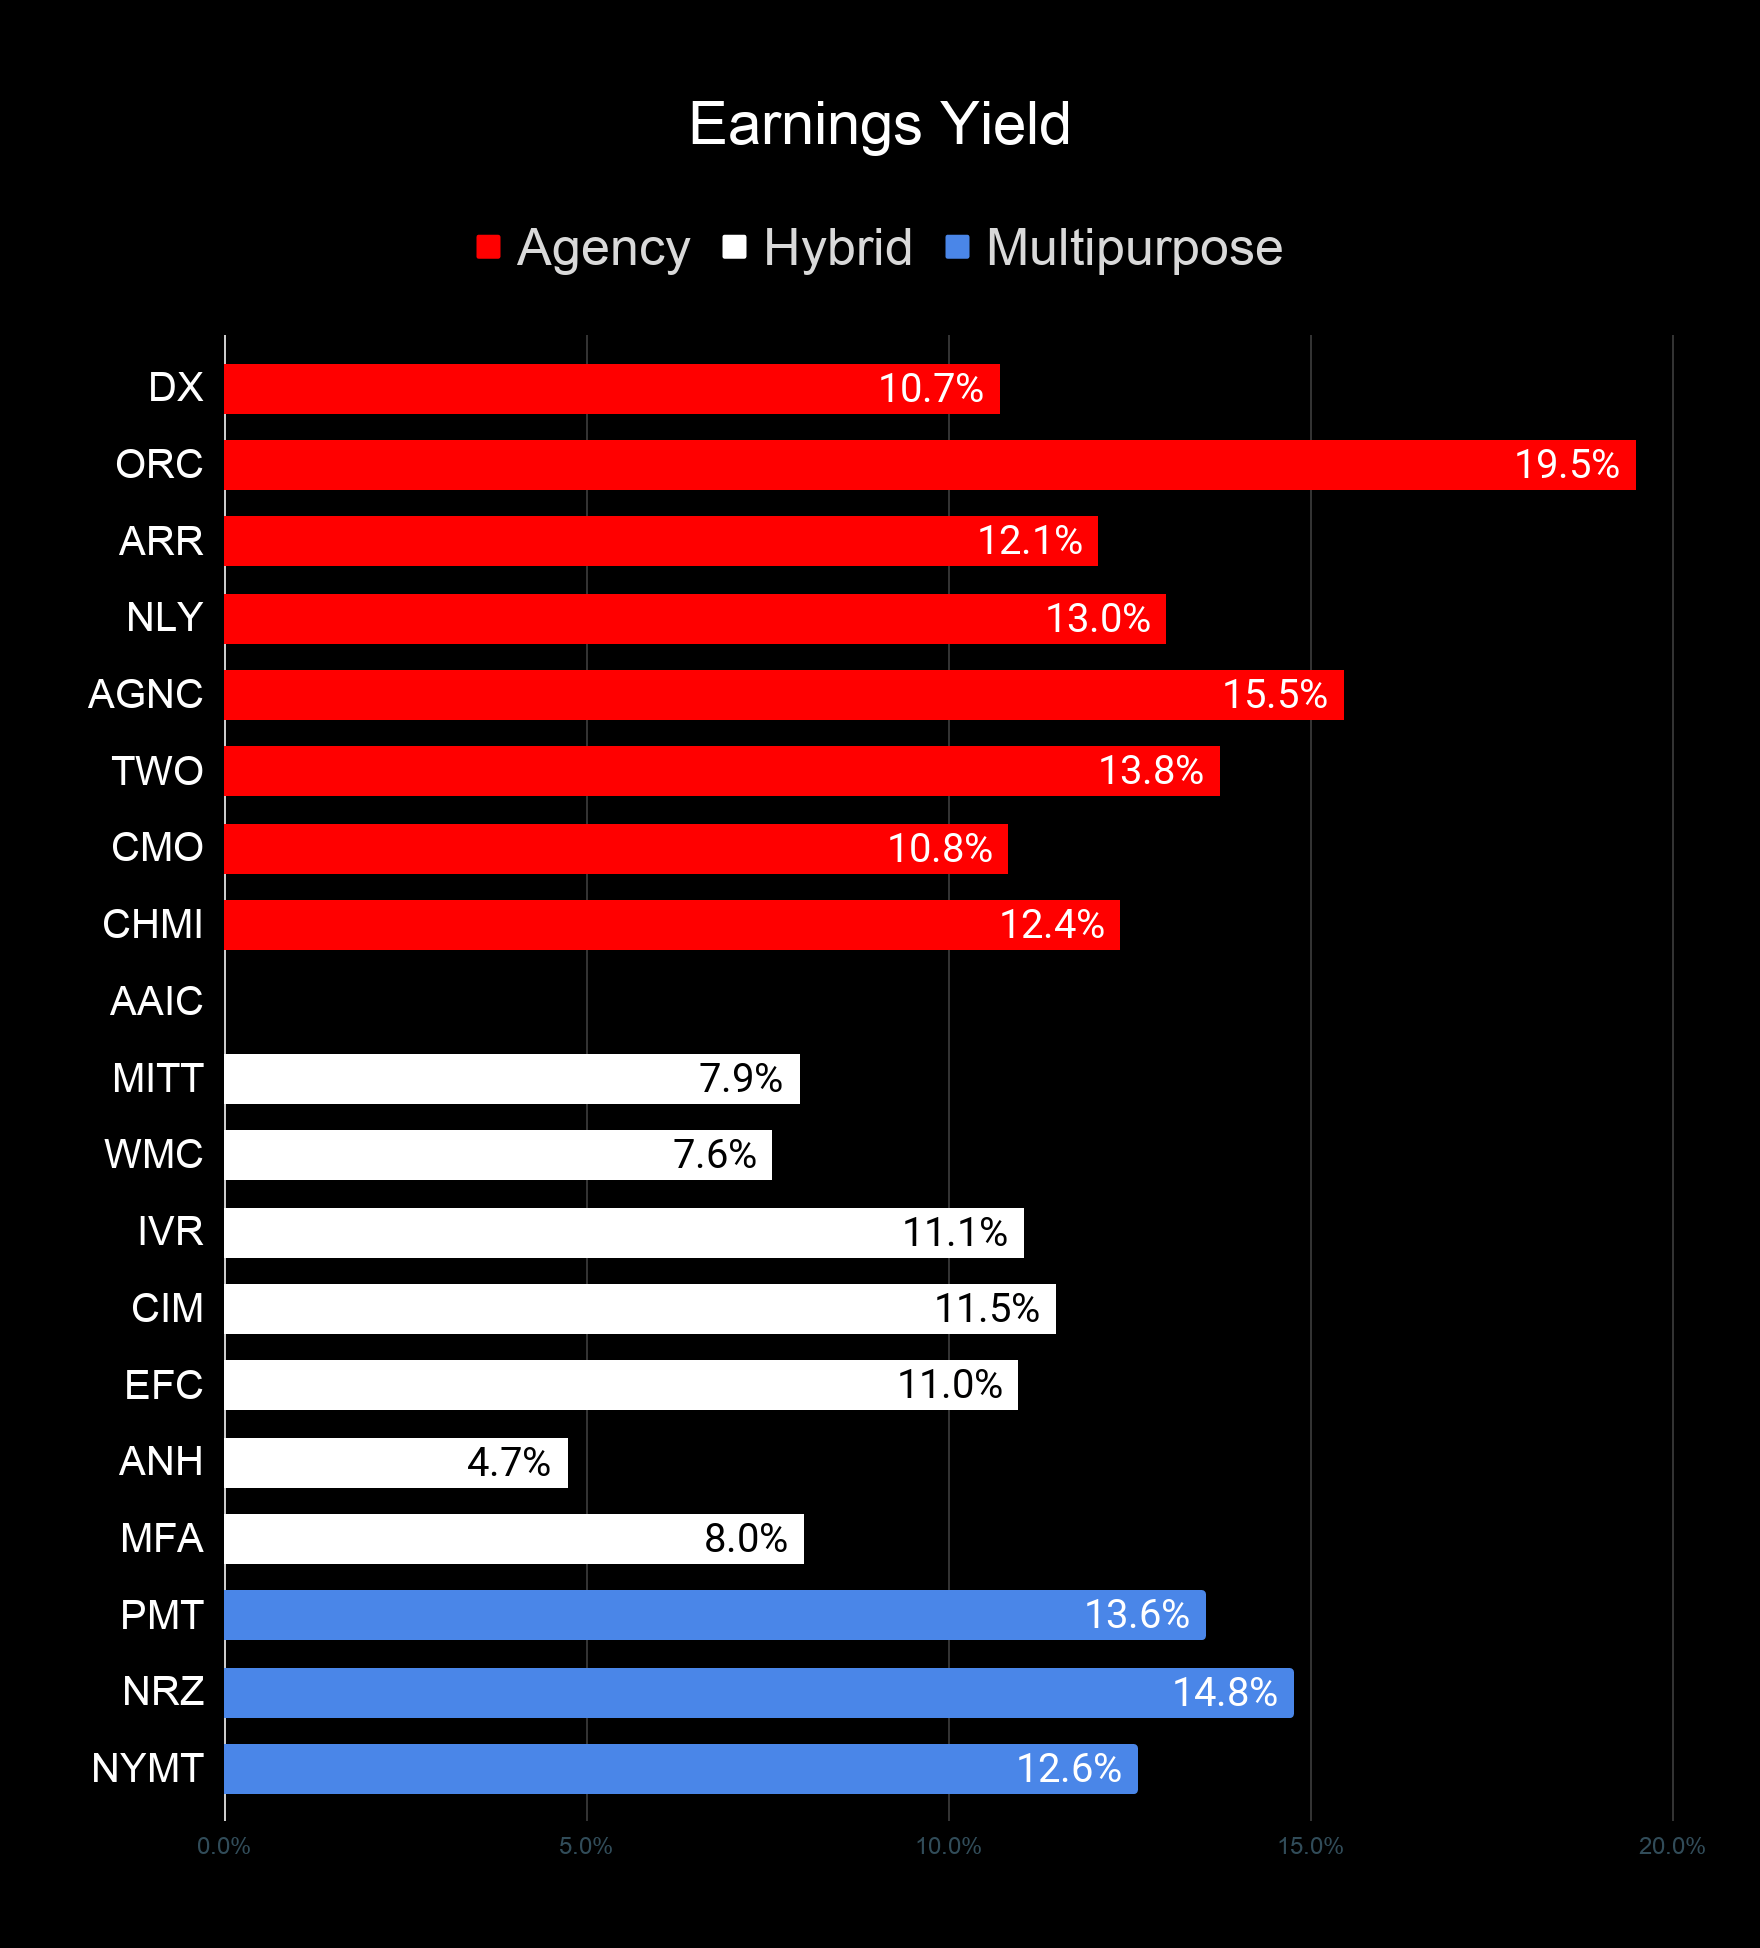
Consensus estimates aren't always the best and there are ways to increase "Core Earnings" through accounting decisions or modifying hedges. Consequently, investors should still take these values cautiously. We do not depend on the consensus estimate to make decisions.
Preferred Shares
After testing out a series on preferred shares, we decided to try merging it into the series on common shares. After all, we are still talking about positions in mortgage REITs. We don't have any desire to cover preferred shares without cumulative dividends, so any preferred shares you see in our column will have cumulative dividends. You can verify that by using Quantum Online. We've included the links in the table below.
To warn readers, it's a big table. We like to give readers a lot of data. We share our interpretation of that data as well, but we want you to know enough to make informed decisions.
To better organize the table, we needed to abbreviate column names as follows:
- Price = Recent Share Price
- BoF = Bond or FTF (Fixed-to-Floating)
- S-Yield = Stripped Yield
- Coupon = Initial Fixed-Rate Coupon
- FYoP = Floating Yield on Price
- NCD = Next Call Date (the soonest shares could be called)
- Note: For all FTF issues, the floating rate would start on NCD.
- WCC = Worst Cash to Call (lowest net cash return possible from a call)
- QO Link = Link to Quantum Online Page
| Ticker | Price | BoF | S-Yield | Coupon | FYoP | NCD | WCC | QO Link | P-Link |
| AGNCM | $24.00 | FTF | 7.26% | 6.88% | 4.81% | 4/15/2024 | $7.02 | AGNCM | Prospectus |
| AGNCN | $24.70 | FTF | 7.18% | 7.00% | 5.48% | 10/15/2022 | $3.80 | AGNCN | Prospectus |
| AGNCO | $23.88 | FTF | 6.89% | 6.50% | 5.54% | 10/15/2024 | $7.62 | AGNCO | Prospectus |
| AGNCP | $23.01 | FTF | 6.74% | 6.13% | 5.42% | 4/15/2025 | $8.88 | AGNCP | Prospectus |
| NLY-D | $24.98 | 7.52% | 7.50% | 7.52% | 12/31/2020 | $0.02 | NLY-D | Prospectus | |
| NLY-F | $24.26 | FTF | 7.17% | 6.95% | 5.39% | 9/30/2022 | $3.78 | NLY-F | Prospectus |
| NLY-G | $23.05 | FTF | 7.06% | 6.50% | 4.78% | 3/31/2023 | $5.60 | NLY-G | Prospectus |
| NLY-I | $24.70 | FTF | 6.84% | 6.75% | 5.29% | 6/30/2024 | $6.21 | NLY-I | Prospectus |
| MFO | $25.25 | Bond | 8.02% | 8.00% | 8.02% | 12/10/2020 | $0.06 | MFO | Prospectus |
| ARR-C | $24.44 | 7.20% | 7.00% | 7.20% | 1/28/2025 | $7.86 | ARR-C | Prospectus | |
| DX-B | $25.20 | 7.67% | 7.63% | 7.67% | 1/4/2021 | $0.21 | DX-B | Prospectus | |
| DX-C | $23.90 | FTF | 7.32% | 6.90% | 6.04% | 4/15/2025 | $8.86 | DX-C | Prospectus |
| CMO-E | $24.69 | 7.71% | 7.50% | 7.71% | 1/4/2021 | $0.72 | CMO-E | Prospectus | |
| EFC-A | $22.62 | FTF | 7.54% | 6.75% | 6.06% | 10/30/2024 | $9.13 | EFC-A | Prospectus |
| NRZ-A | $23.20 | FTF | 8.18% | 7.50% | 6.58% | 8/15/2024 | $8.84 | NRZ-A | Prospectus |
| NRZ-B | $22.52 | FTF | 8.01% | 7.13% | 6.60% | 8/15/2024 | $9.17 | NRZ-B | Prospectus |
| NRZ-C | $20.10 | FTF | 8.03% | 6.38% | 6.55% | 2/15/2025 | $11.69 | NRZ-C | Prospectus |
| PMT-A | $24.88 | FTF | 8.18% | 8.13% | 6.10% | 3/15/2024 | $6.72 | PMT-A | Prospectus |
| PMT-B | $24.69 | FTF | 8.11% | 8.00% | 6.31% | 6/15/2024 | $7.31 | PMT-B | Prospectus |
| AIC | $24.25 | Bond | 6.97% | 6.75% | 6.97% | 1/4/2021 | $0.84 | AIC | Prospectus |
| AIW | $24.60 | Bond | 6.80% | 6.63% | 6.80% | 1/4/2021 | $0.68 | AIW | Prospectus |
| ANH-A | $25.29 | 8.67% | 8.63% | 8.67% | 1/4/2021 | $0.17 | ANH-A | Prospectus | |
| ANH-C | $24.58 | 7.87% | 7.63% | 7.87% | 1/4/2021 | $0.83 | ANH-C | Prospectus | |
| CIM-A | $24.70 | 8.25% | 8.00% | 8.25% | 10/30/2021 | $2.37 | CIM-A | Prospectus | |
| CIM-B | $23.33 | FTF | 8.74% | 8.00% | 6.58% | 3/30/2024 | $8.57 | CIM-B | Prospectus |
| CIM-C | $23.04 | FTF | 8.57% | 7.75% | 5.50% | 9/30/2025 | $11.56 | CIM-C | Prospectus |
| CIM-D | $23.04 | FTF | 8.85% | 8.00% | 6.21% | 3/30/2024 | $8.86 | CIM-D | Prospectus |
| TWO-A | $24.67 | FTF | 8.35% | 8.13% | 6.05% | 04/27/2027 | $13.55 | TWO-A | Prospectus |
| TWO-B | $23.78 | FTF | 8.13% | 7.63% | 5.95% | 07/27/2027 | $14.10 | TWO-B | Prospectus |
| TWO-C | $21.91 | FTF | 8.39% | 7.25% | 6.06% | 01/27/2025 | $10.81 | TWO-C | Prospectus |
| TWO-D | $24.50 | 8.03% | 7.75% | 8.03% | 1/4/2021 | $0.91 | TWO-D | Prospectus | |
| TWO-E | $23.96 | 7.94% | 7.50% | 7.94% | 1/4/2021 | $1.44 | TWO-E | Prospectus | |
| CHMI-A | $25.09 | 8.30% | 8.20% | 8.30% | 8/17/2022 | $3.60 | CHMI-A | Prospectus | |
| CHMI-B | $23.96 | FTF | 8.75% | 8.25% | 6.22% | 4/15/2024 | $8.18 | CHMI-B | Prospectus |
| IVR-A | $24.62 | 7.99% | 7.75% | 7.99% | 1/4/2021 | $0.77 | IVR-A | Prospectus | |
| IVR-B | $23.33 | FTF | 8.31% | 7.75% | 5.80% | 12/27/2024 | $9.43 | IVR-B | Prospectus |
| IVR-C | $23.00 | FTF | 8.16% | 7.50% | 6.01% | 9/27/2027 | $14.67 | IVR-C | Prospectus |
| NYMTM | $22.69 | FTF | 8.82% | 7.88% | 7.46% | 1/15/2025 | $10.68 | NYMTM | Prospectus |
| NYMTN | $23.25 | FTF | 8.74% | 8.00% | 6.48% | 10/15/2027 | $15.74 | NYMTN | Prospectus |
| NYMTO | $22.78 | 8.79% | 7.88% | 8.79% | 1/4/2021 | $2.65 | NYMTO | Prospectus | |
| NYMTP | $22.83 | 8.63% | 7.75% | 8.63% | 1/4/2021 | $2.59 | NYMTP | Prospectus | |
| AAIC-B | $21.40 | 8.34% | 7.00% | 8.34% | 5/12/2022 | $6.36 | AAIC-B | Prospectus | |
| AAIC-C | $21.70 | FTF | 9.72% | 8.25% | 6.94% | 3/30/2024 | $10.44 | AAIC-C | Prospectus |
| MFA-B | $23.58 | 7.96% | 7.50% | 7.96% | 1/4/2021 | $1.44 | MFA-B | Prospectus | |
| MFA-C | $21.26 | FTF | 7.65% | 6.50% | 6.56% | 3/31/2025 | $10.64 | MFA-C | Prospectus |
| MITT-A | $19.95 | 10.37% | 8.25% | 10.37% | 1/4/2021 | $5.12 | MITT-A | Prospectus | |
| MITT-B | $19.57 | 10.25% | 8.00% | 10.25% | 1/4/2021 | $5.50 | MITT-B | Prospectus | |
| MITT-C | $19.78 | FTF | 10.14% | 8.00% | 8.50% | 9/17/2024 | $12.70 | MITT-C | Prospectus |
There are a few things you should know at the start:
- When a share can be called on short notice, the annualized yield-to-call reaches absurd levels. Investors shouldn't put too much weight on it. On the other hand, a negative number can be a significant concern. Consequently, we decided to include it in the chart.
- We sort our spreadsheet for subscribers by risk ratings within each sector. We decided to use the same technique for this series since it communicates more information to readers. You'll notice a general correlation where lower risk correlates with a higher price and lower yield, though this link isn't absolute.
For each metric we have 2 charts. Why use two charts? Because it is much more convenient for readers who want to enlarge the charts. We simply can't fit 40+ shares into a single chart and still have it show up well on a mobile device.
Share Prices
We will start with the prices:
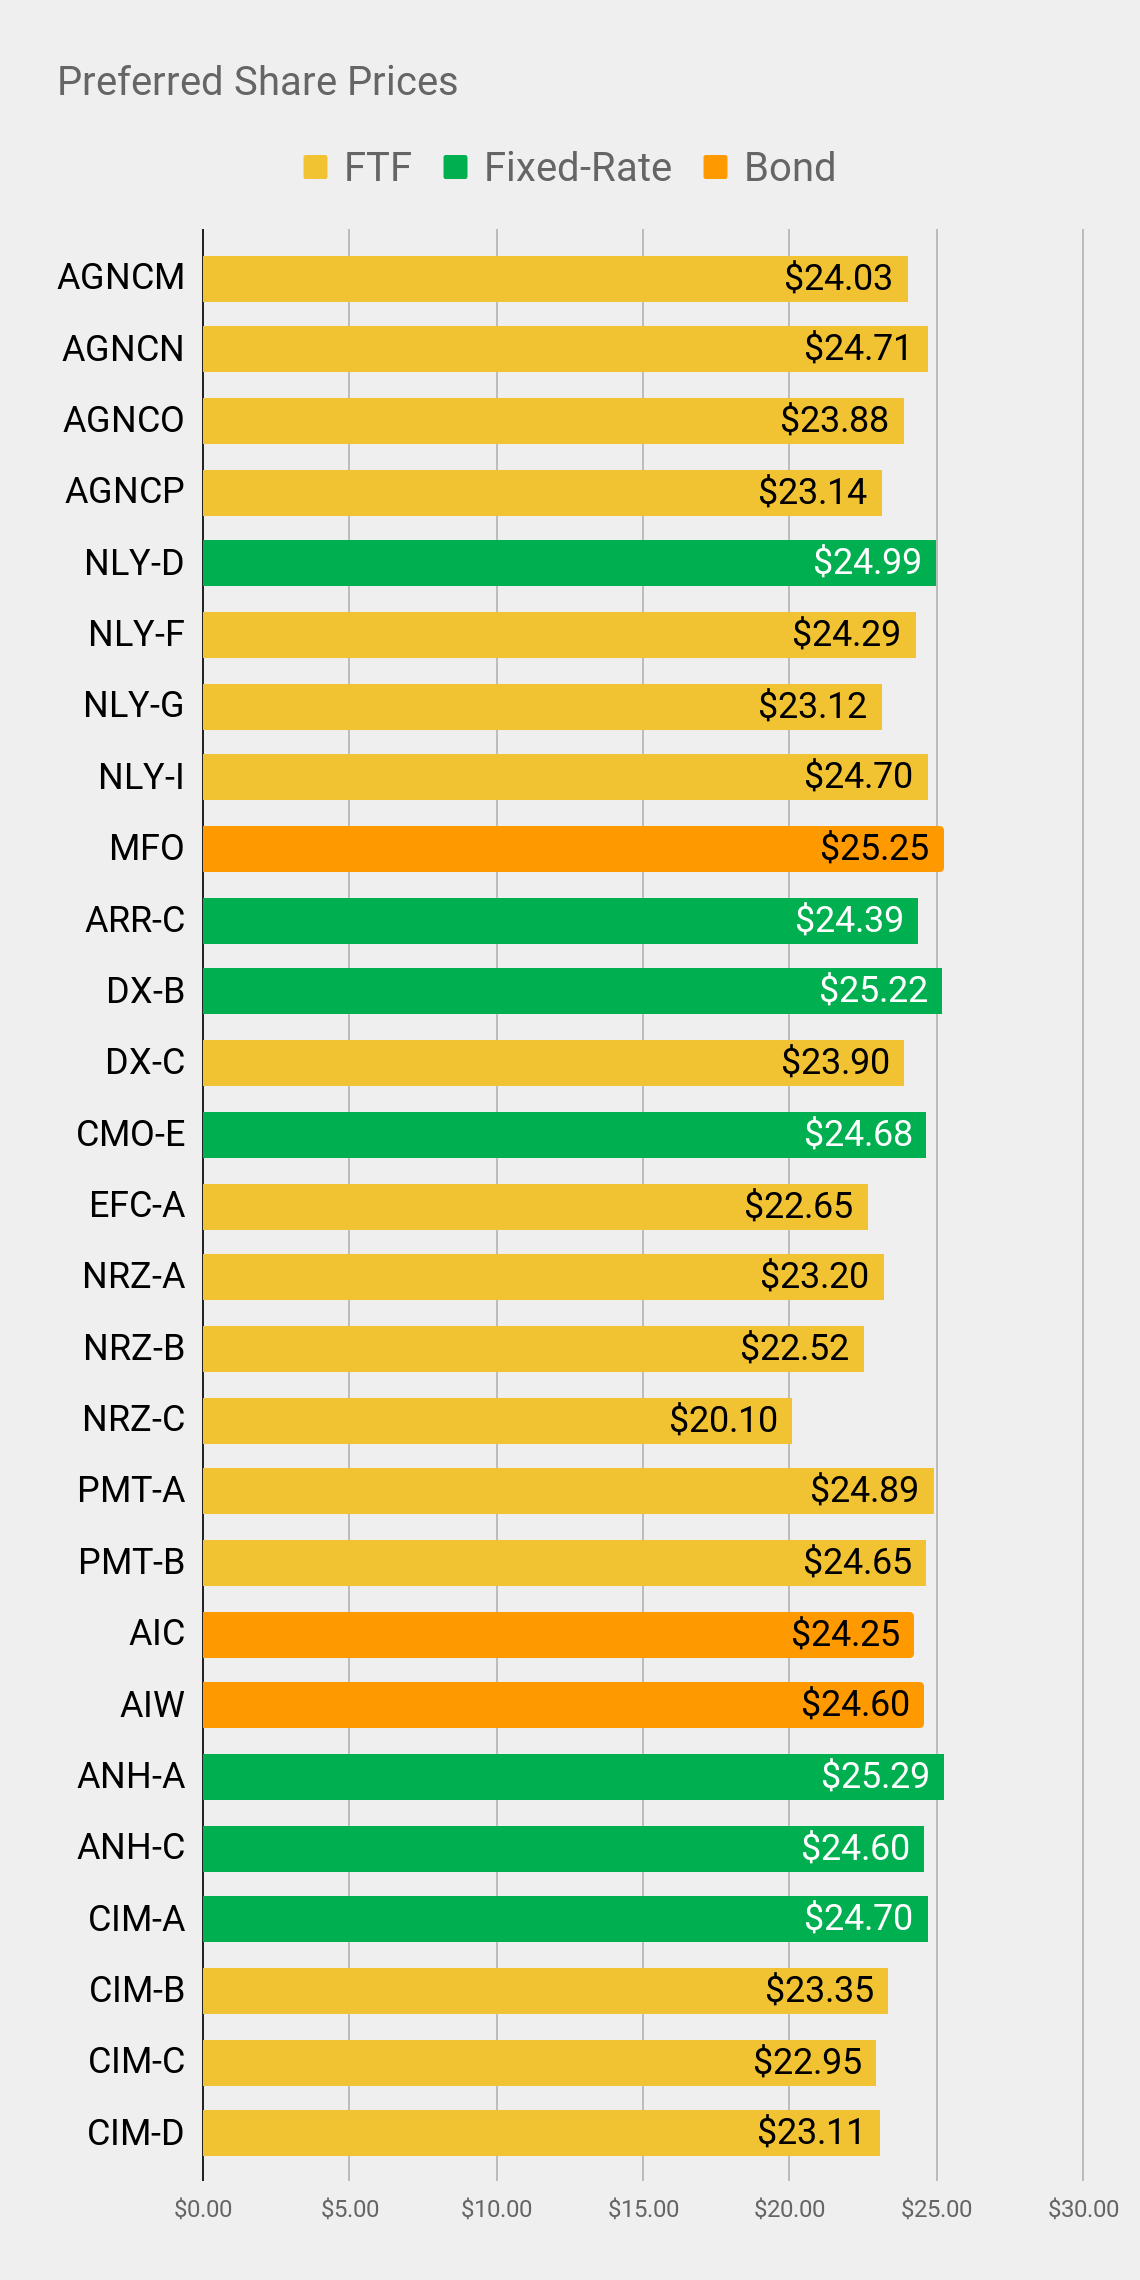
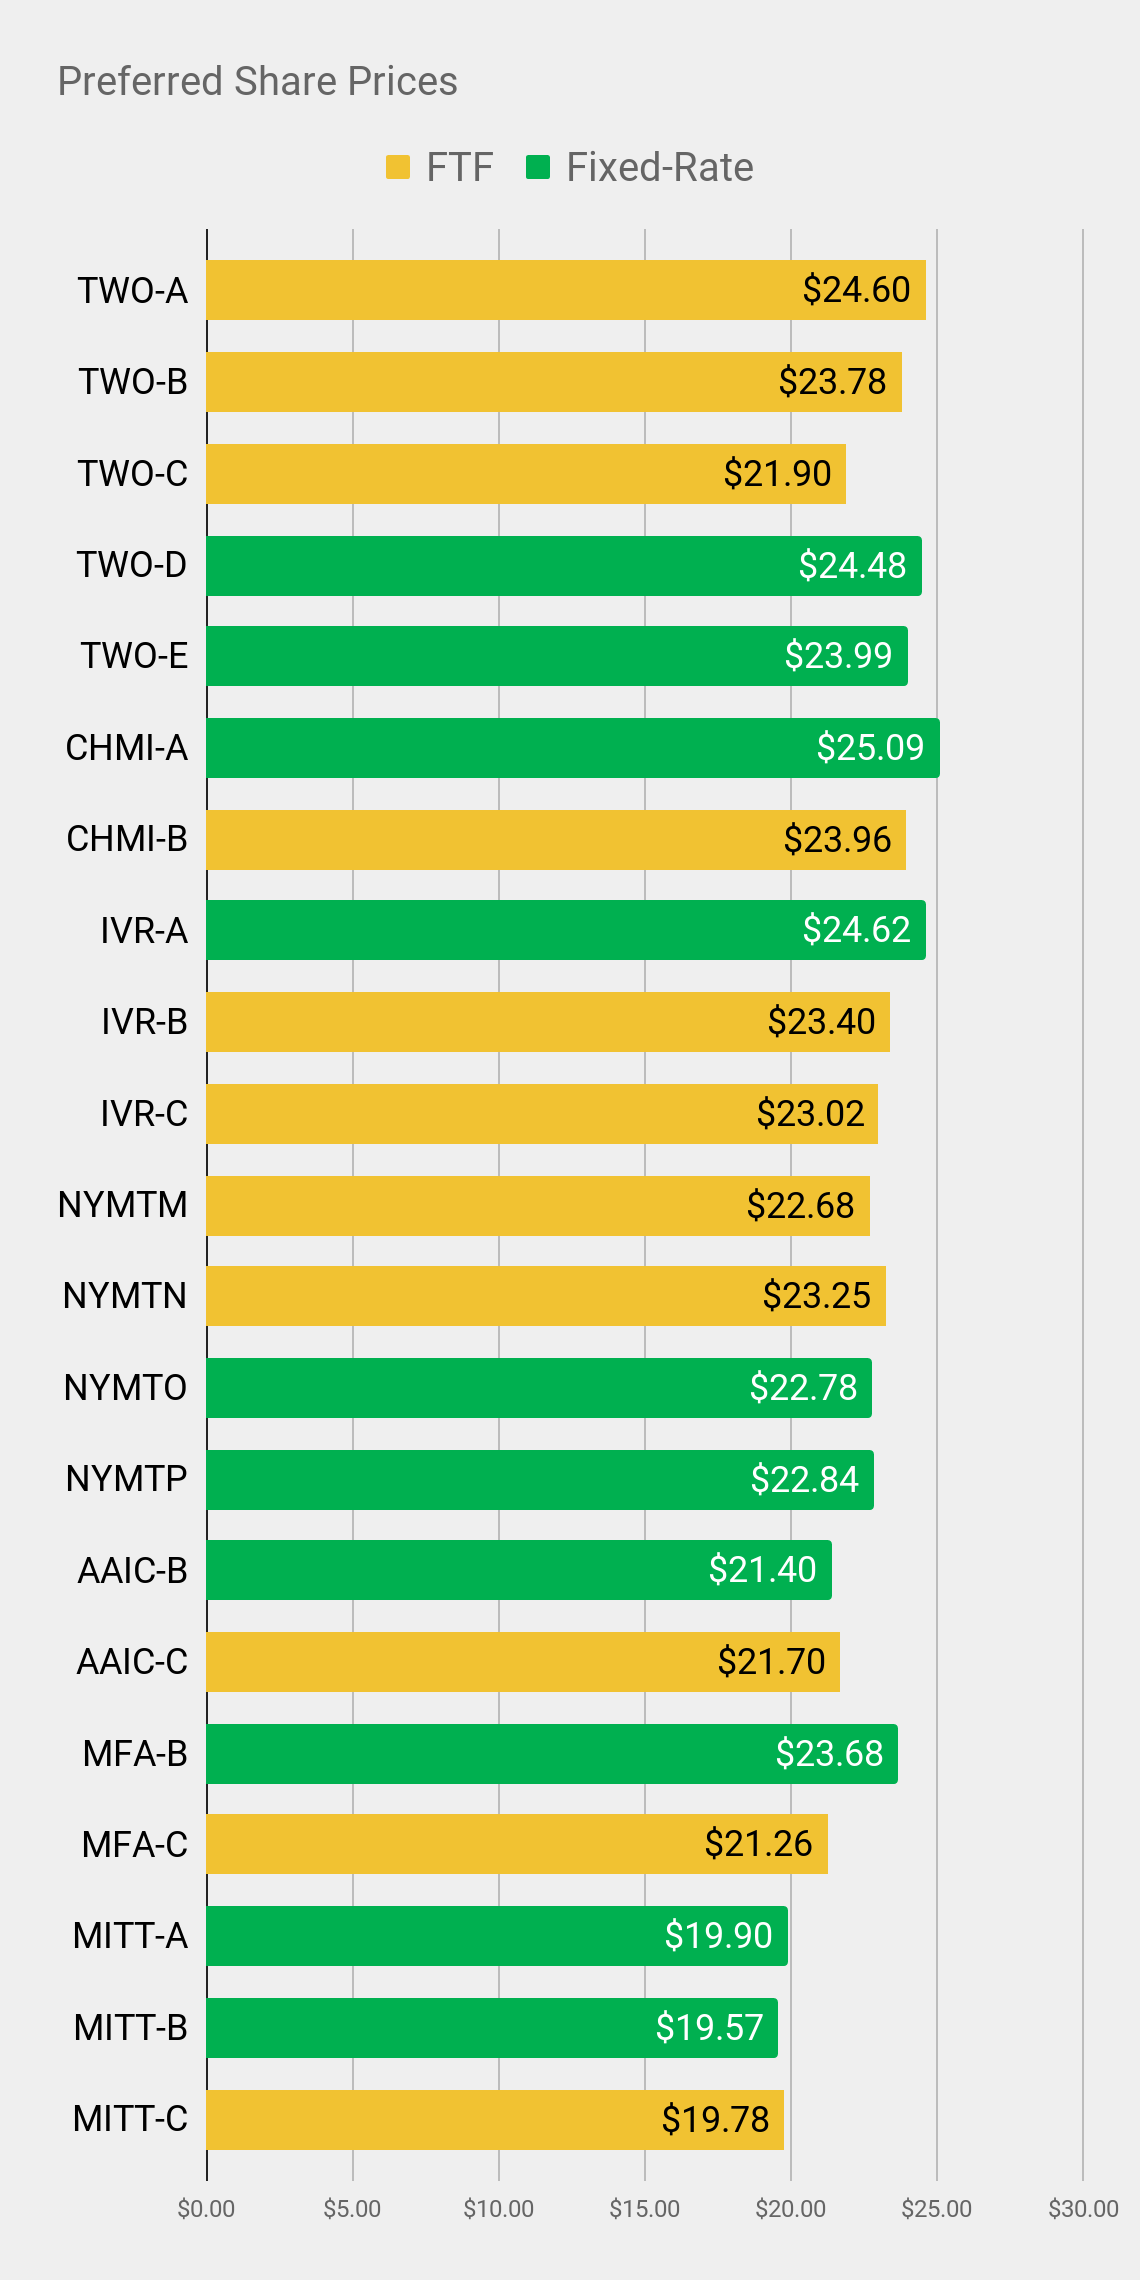
That chart gives you a pretty quick feel for which shares are trading at a discount to call value. Each of these preferred shares has a call value of $25.00, but that doesn't mean a share will be called. The company decides if they want to issue a call or not.
Dividend Yield
Let's move onto the stripped yield. This is the way dividend yields should be handled for preferred shares:
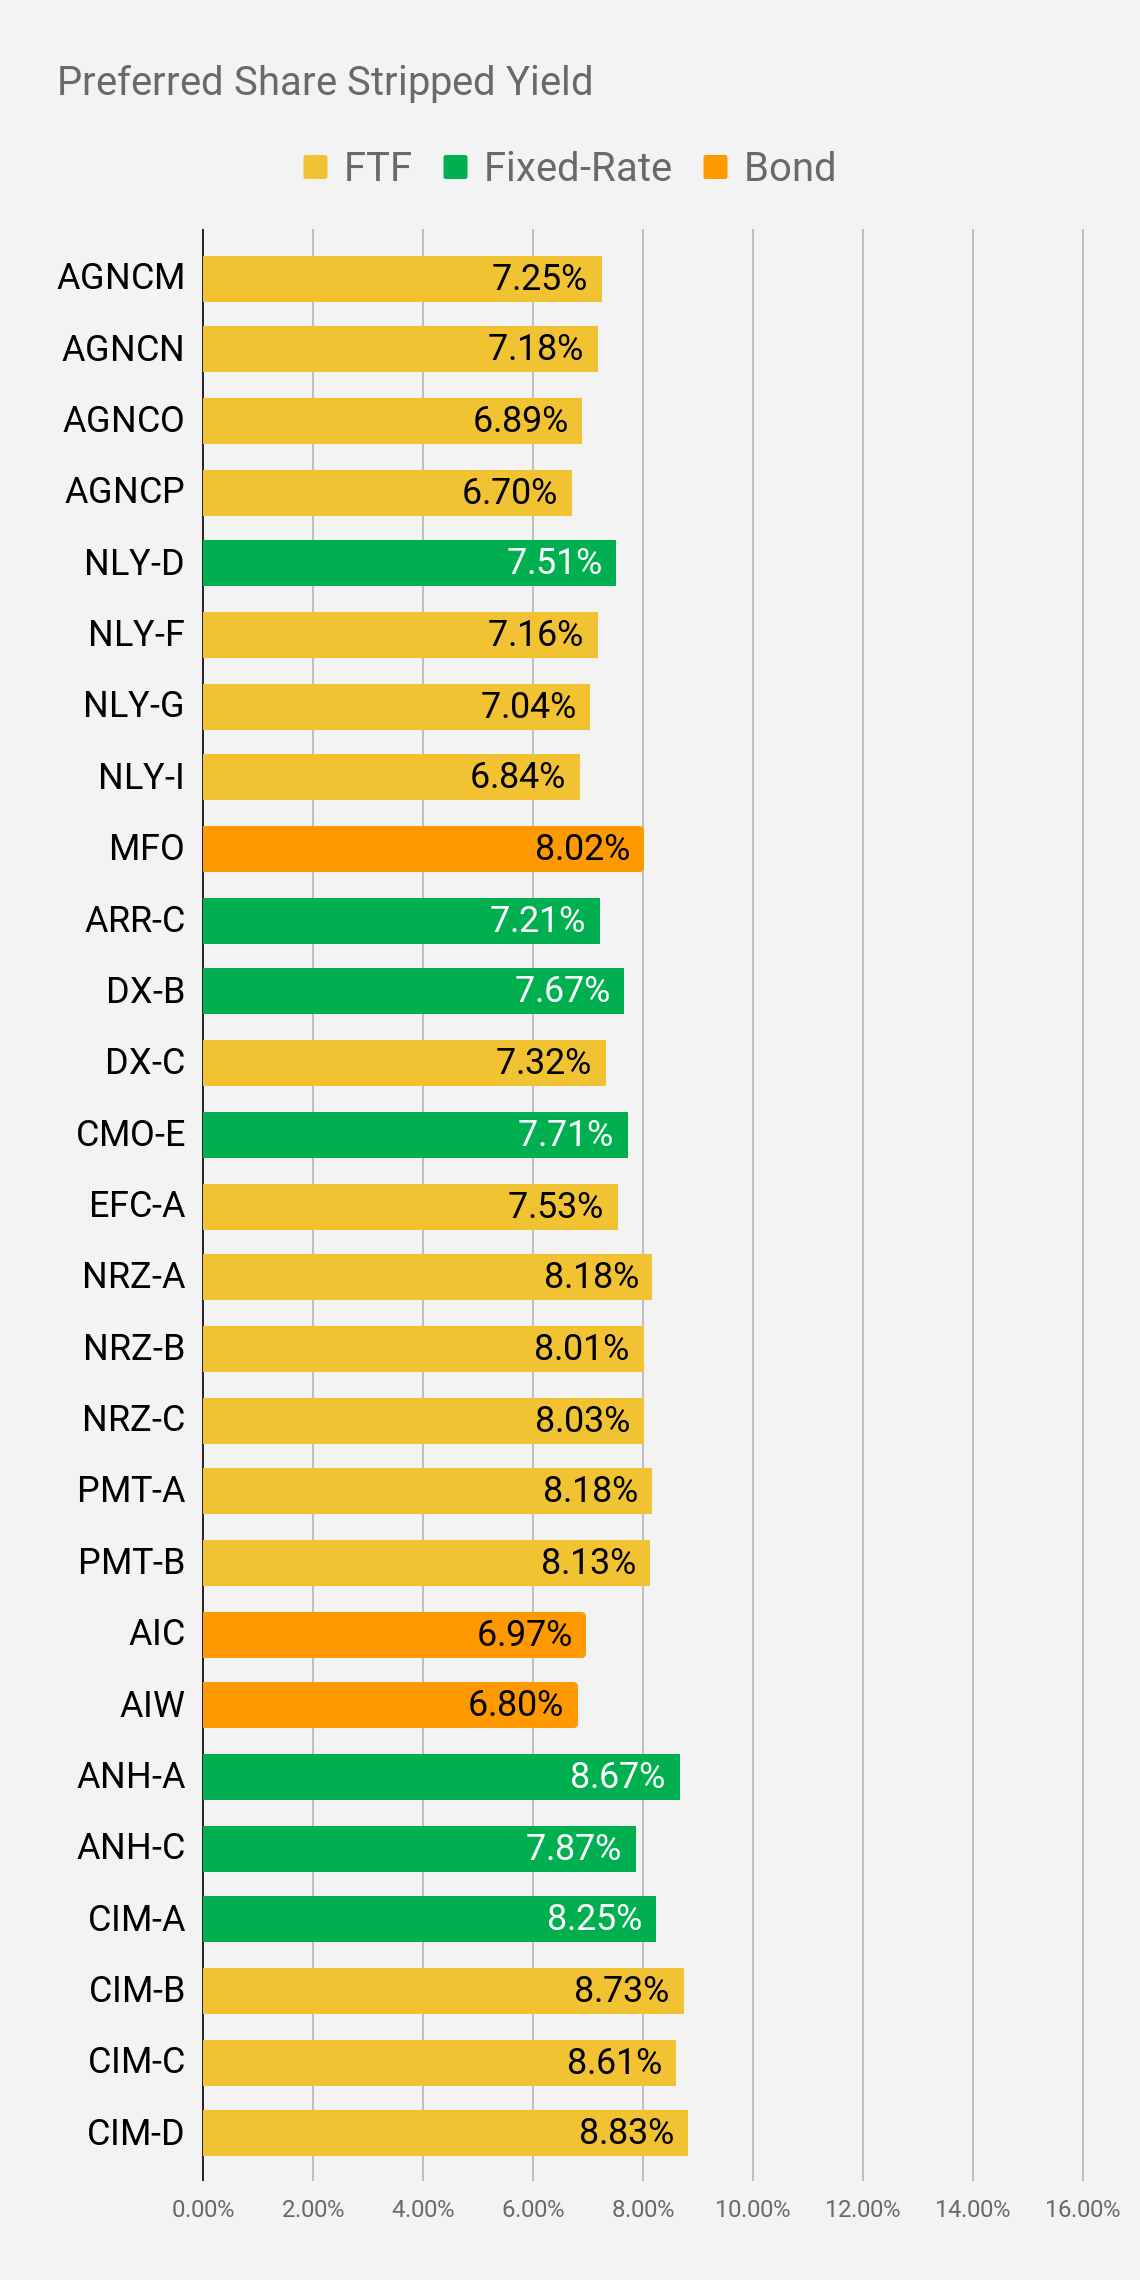
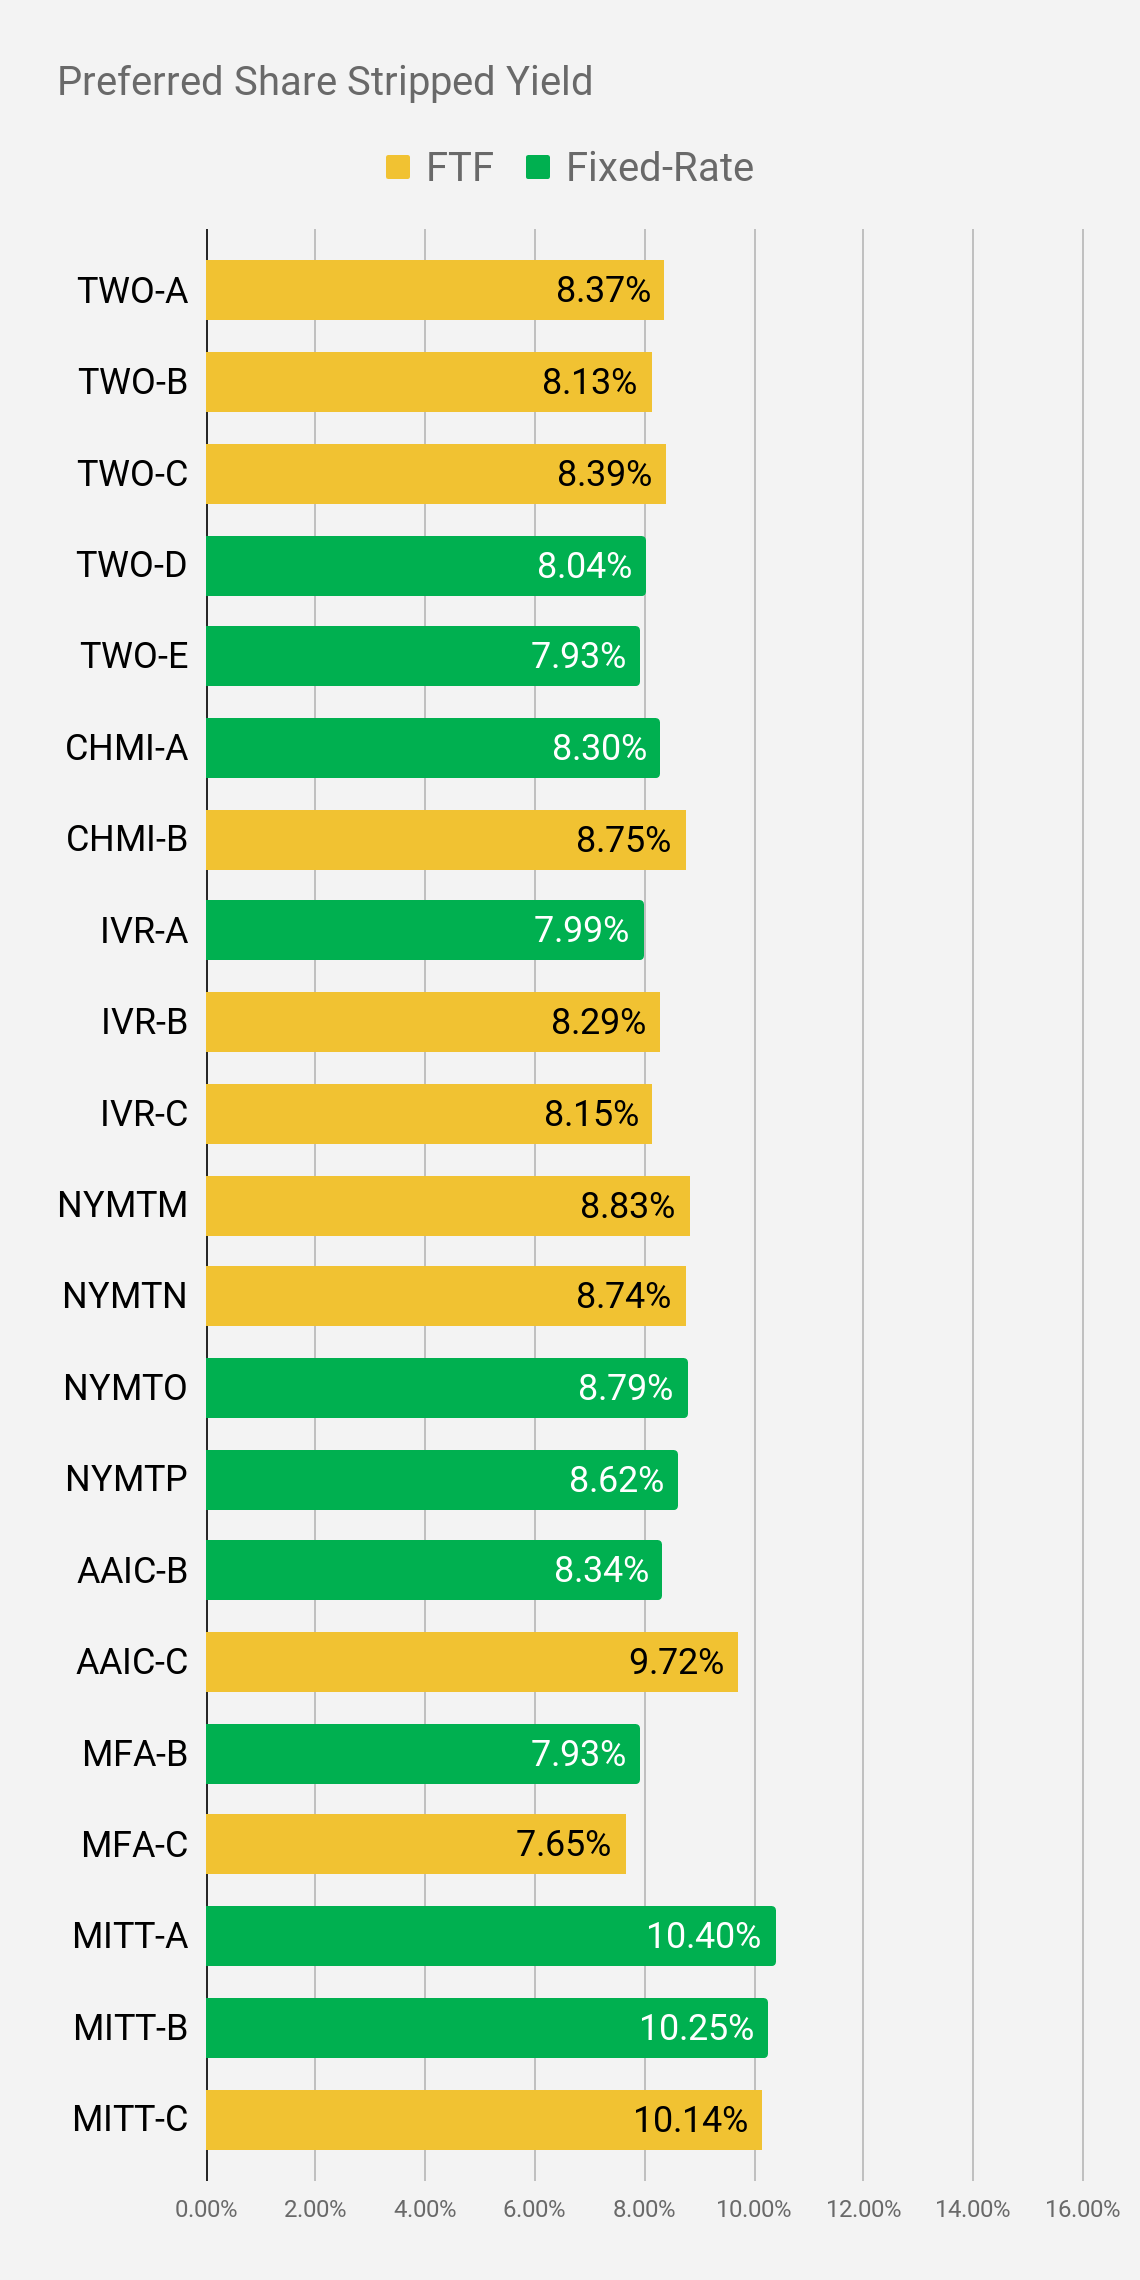
Stripped yields are vastly more useful than "current" yields for preferred shares. The stripped yield uses the stripped price. That's different from using the current price because it means we already adjusted for dividend accrual. This makes the process easier for investors.
We can talk about shares using "regular prices". Those are the prices an investor would actually use when entering an order.
However, we will provide the stripped yield to adjust for the dividend accrual. In the spreadsheets we host for subscribers, we include the actual ex-dividend date, or the projected ex-dividend date if the actual date isn't yet known. If you're planning to buy a share, it's always wise to check if the shares just went ex-dividend so you can adjust your targets accordingly.
Floating Rate Dividend Yields
Since many of these shares switch over to floating rates, we also want to consider what the yield would be if the floating rate was in effect and shares were still at the current price. To demonstrate that, we use the "Floating Yield On Price". If the share remains at a fixed-rate indefinitely, then the value doesn't change:
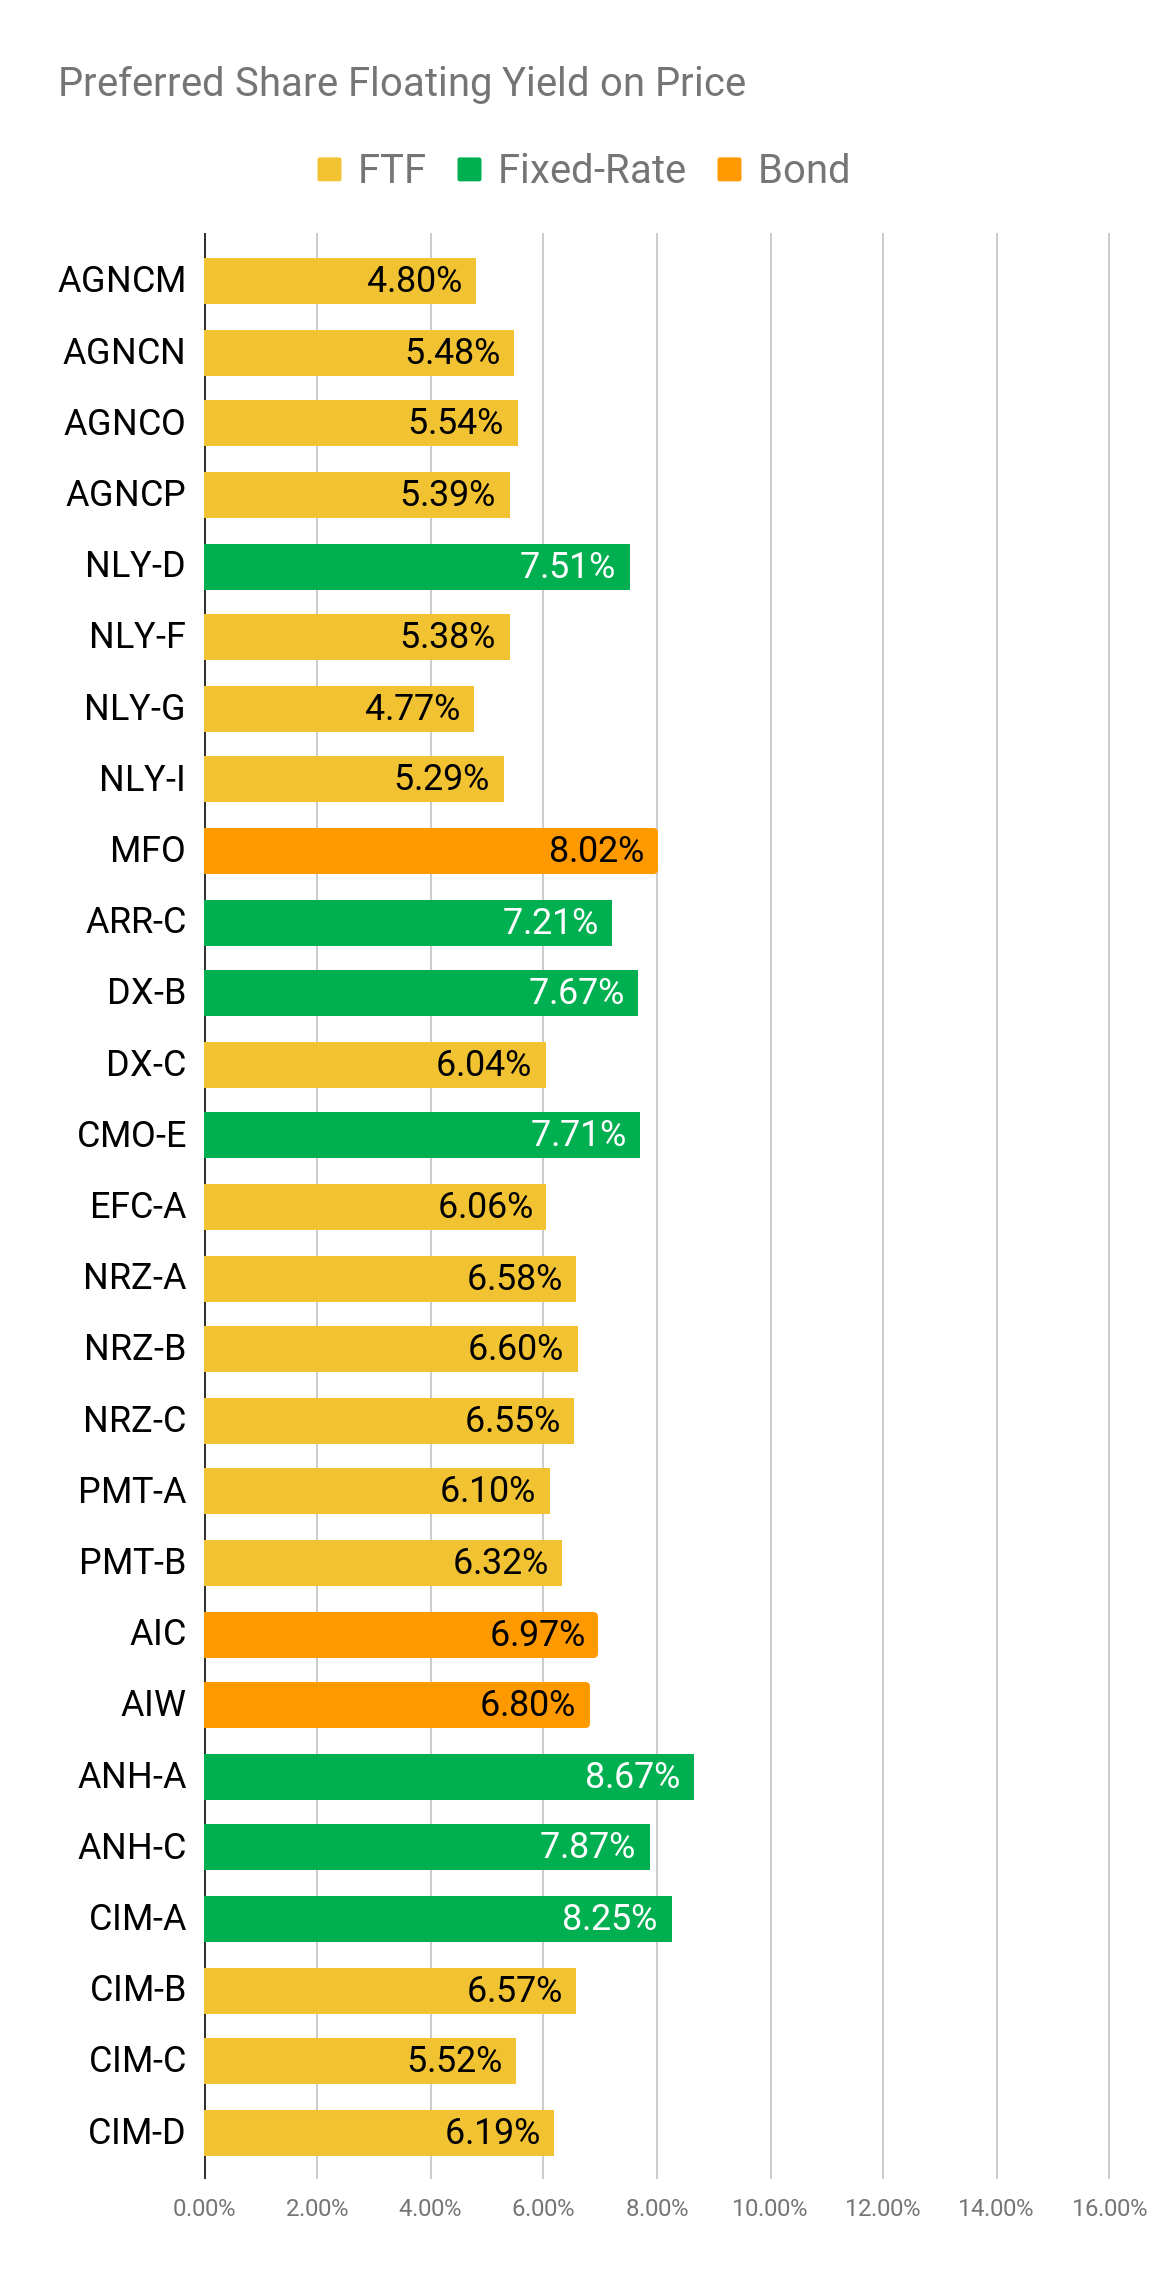
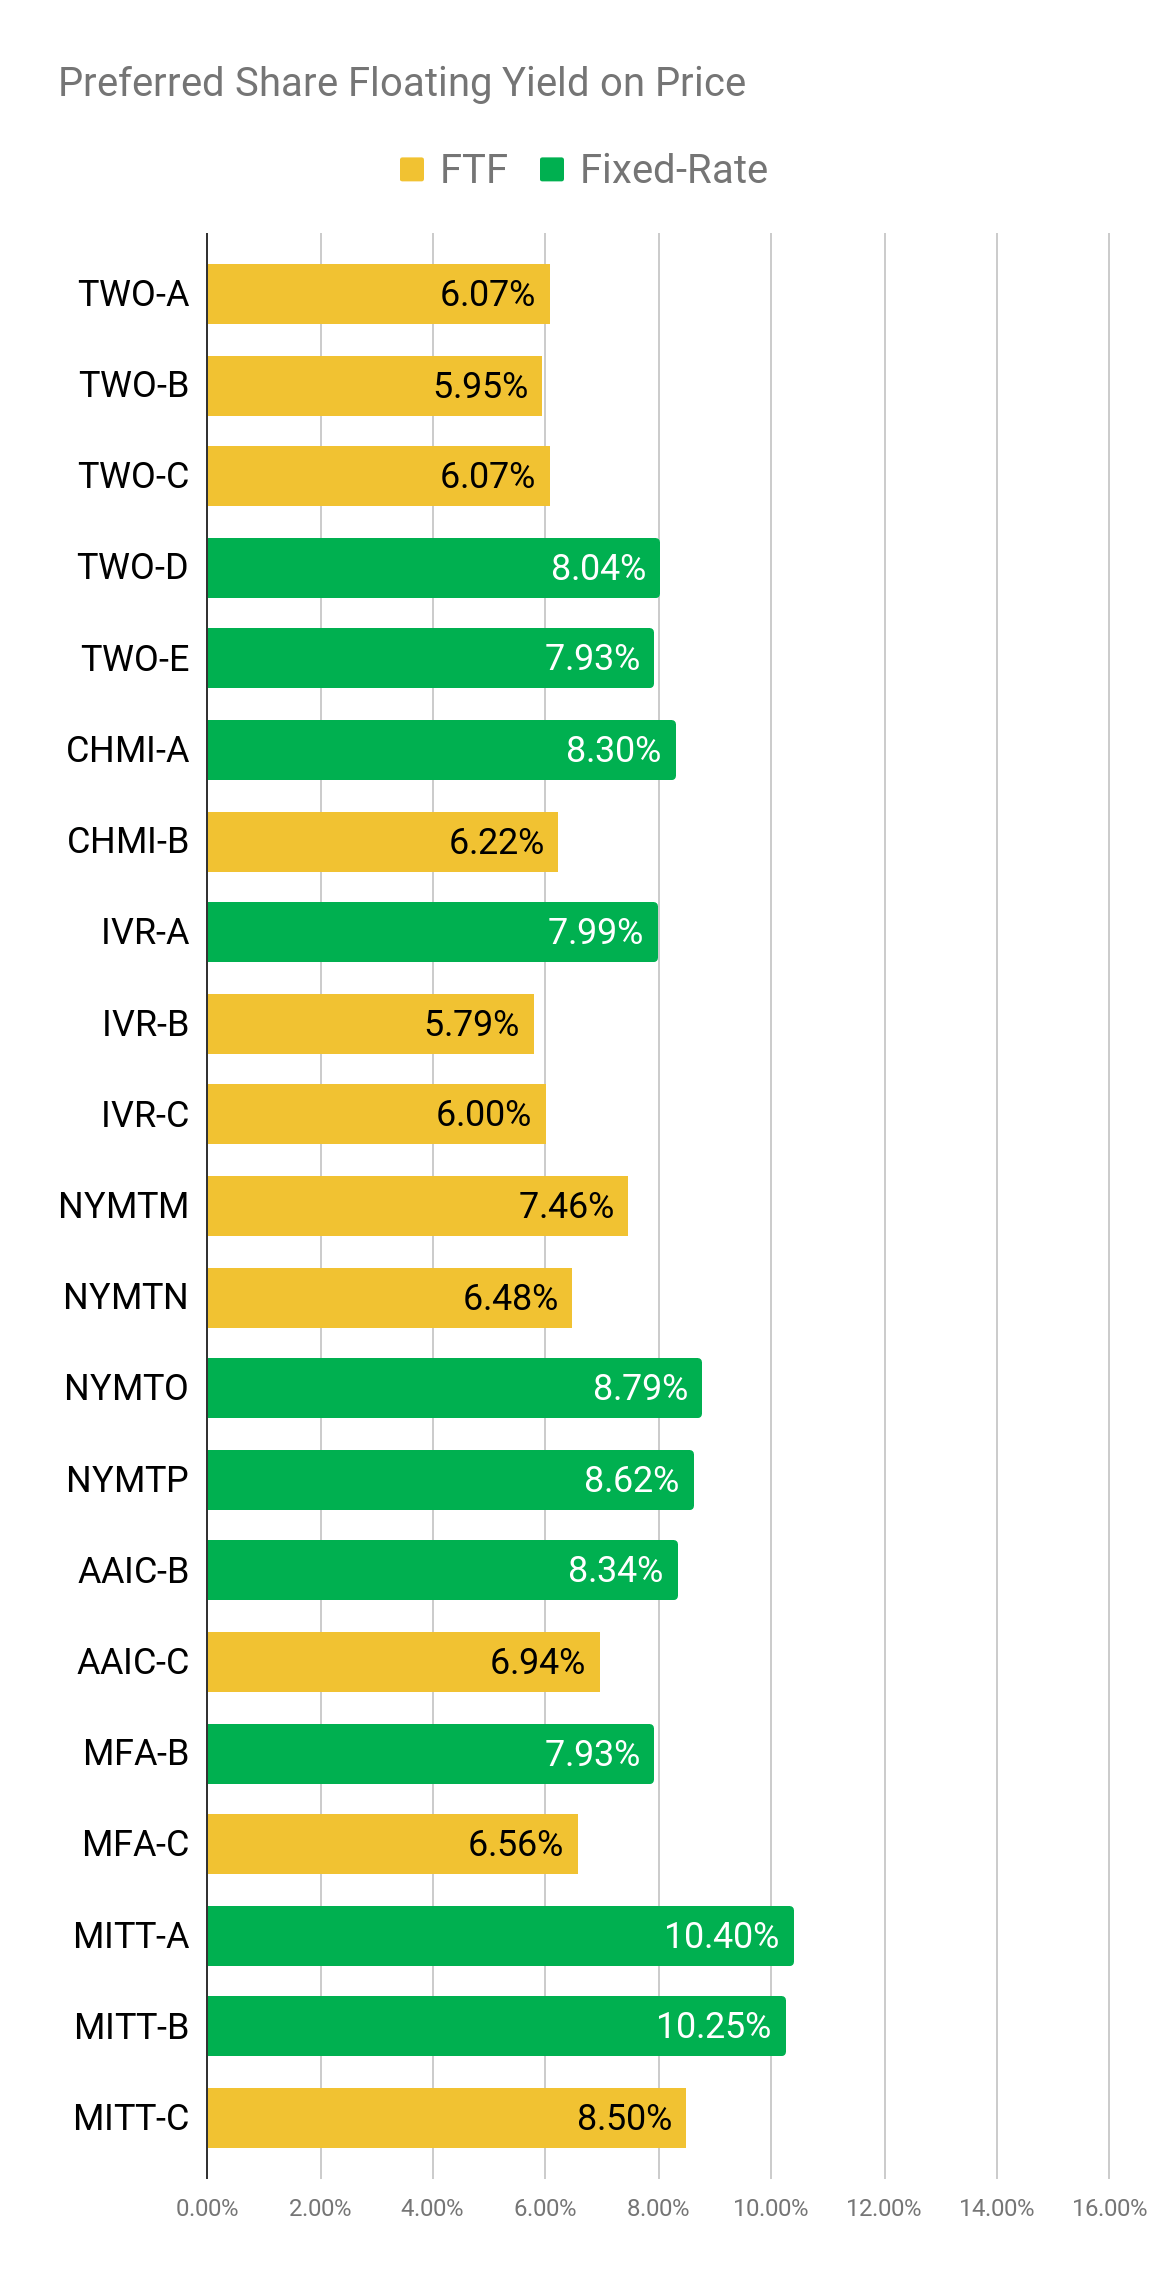
One point we need to emphasize here is that we are dealing with yields. A yield must involve the share price. We aren't simply showing the new "rate" if the share began floating, we are adjusting the new rate for the stripped price.
Conclusion
You don't have to follow us. You don't have to care about our research. If you're happy with a high dividend yield and a dwindling account value, there are plenty of authors who can cater to you. On the other hand, if you're focused on generating total returns and want to use REITs to do it, you may love our research.
