
Microsoft is the largest corporation with a market capitalization above $1 trillion. This technology giant should be bought on weakness to its second-half value level at $131.71 down to its value level for July at $130.76. My price target for the third quarter is $144.26.
Microsoft is a growth stock that just keeps growing. The stock is not fundamentally cheap, however, as its P/E ratio is elevated at 29.70 with a puny dividend yield of 1.37%, according to Macrotrends.
The company has outperformed the market both year to date and since its Dec. 26 low of $93.96. The stock is up 33.6% year to date and in bull market territory 44.4% above the low. Microsoft has beaten earnings-per-share estimates in 12 consecutive quarters leading the stock to its all-time intraday high of $138.40 set on June 24.
The Daily Chart for Microsoft
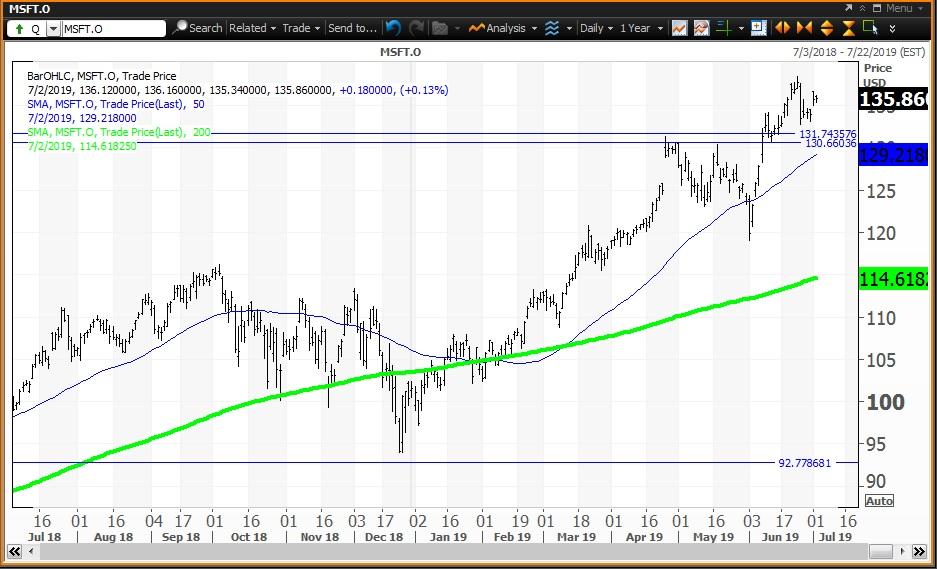
The daily chart for Microsoft shows the formation of a "golden cross" on March 12. A "golden cross" occurs when the 50-day simple moving average rises above the 200-day simple moving average, indicating that higher prices lie ahead. Today the 50-day and 200-day SMAs are $129.22 and $114.62, respectively. When the stock traded to its Dec. 26 low of $93.96 and closed that day at $100.56, a "key reversal" occurred as this close was above its Dec. 24 high of $97.97. The Dec. 31 close of $101.57 was an important input to my proprietary analytics. The annual value level remains at $92.72 for all of 2019. The close of $133.96 on June 28 was input to my analytics and new weekly, monthly, quarterly and semiannual levels are in play. The weekly value level is $131.96. Semiannual and monthly value levels are $131.71 and $130.76, respectively, with a quarterly risky level above the chart at $144.26.
The Weekly Chart for Microsoft
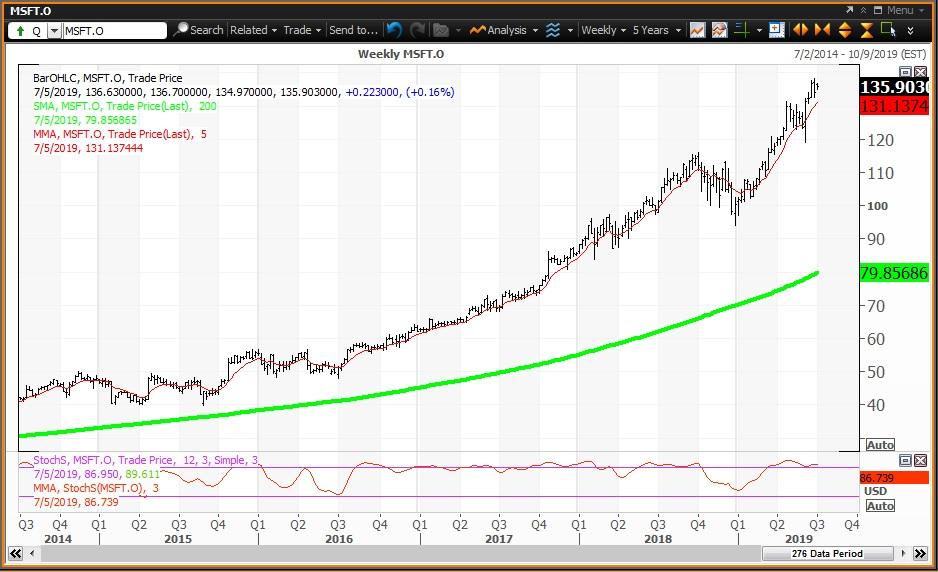
The weekly chart for Microsoft is positive but overbought, with the stock above its five-week modified moving average of $131.14. The stock is well above its 200-week simple moving average or "reversion to the mean" at $79.86. The 12x3x3 weekly slow stochastic reading is projected to end the week at 86.25 above the overbought threshold of 80.00. If this reading rises above 90.00, the stock would be in an "inflating parabolic bubble." This is a warning of a pending 10% to 20% correction below the nearby value levels.
Trading Strategy: Buy weakness to the semiannual and monthly value levels at $131.71 and $130.76, respectively, and reduce holdings on strength to its quarterly risky level at $144.26.
